Clear Sky Science · en
Far-field extraction of the dielectric function of exfoliated flakes near phonon resonances
Listening to Vibrations in Tiny Crystals
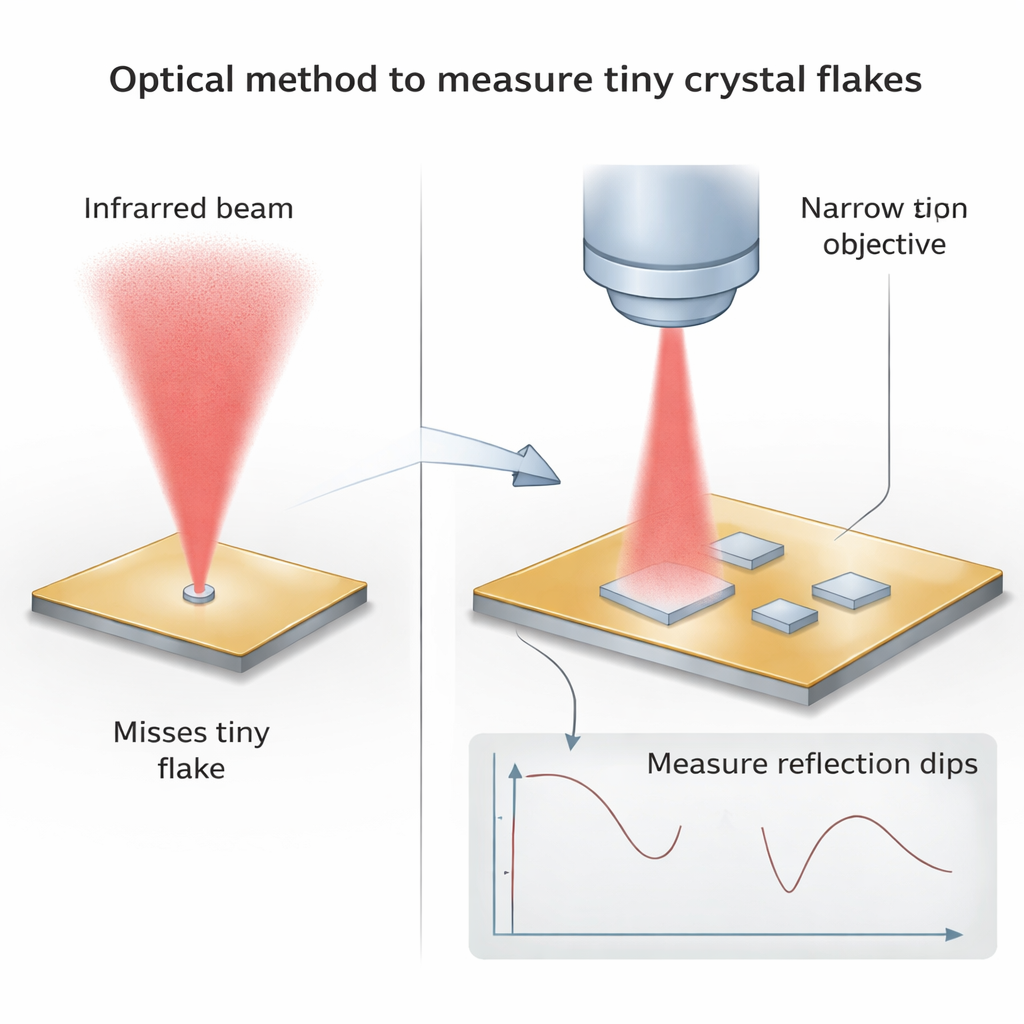
Many of today’s most exciting technologies—better infrared cameras, gas sensors, and energy-harvesting devices—depend on how light interacts with materials only a few atoms thick. But there is a catch: the best samples of these “van der Waals” crystals are tiny flakes, often smaller than the spot of light used to measure them. This paper presents a practical way for ordinary infrared microscopes to accurately read out how such flakes respond to light, without relying on exotic, expensive nanoscale probes.
Why Measuring Small Flakes Is So Hard
Mid‑infrared light, which sits between visible light and microwaves, is ideal for sensing molecules and managing heat. Many layered crystals, such as hexagonal boron nitride (hBN) and alpha‑molybdenum trioxide (α‑MoO₃), have strong vibrations of their atoms in this range. These vibrations can couple to light and create long‑lived surface waves called phonon polaritons, enabling extreme control of infrared light on scales far smaller than its wavelength. To design devices that exploit these effects, researchers must know the material’s “dielectric function” across frequency—a measure of how strongly it stores and dissipates electromagnetic energy. Traditional tools like spectroscopic ellipsometry use large infrared beams and assume large, uniform samples, which breaks down for flakes only tens of micrometers across. Earlier work solved this by imaging polaritons with sharp tips placed nanometers above the surface, but such setups are costly, slow, and mathematically complex.
A Simpler Way: Reading Dips in Reflected Light
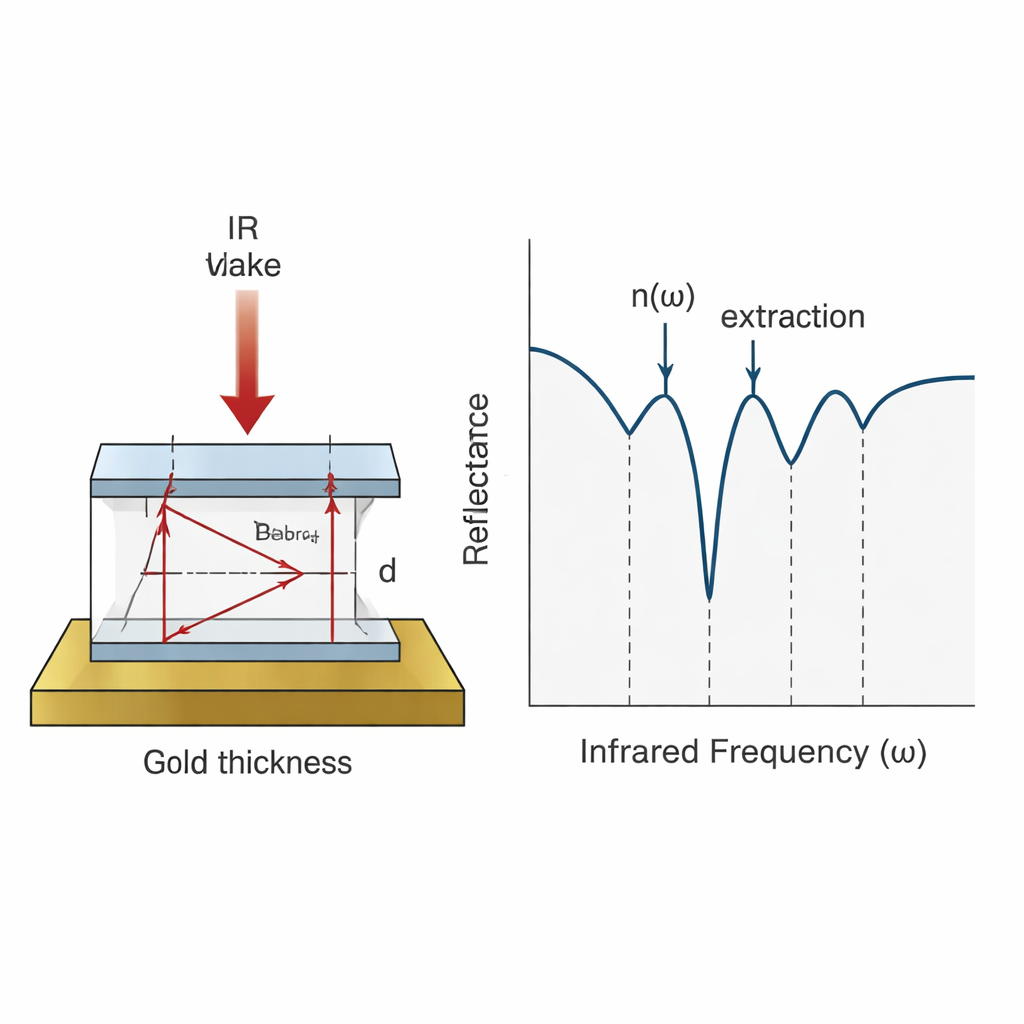
The authors show that a much simpler measurement—far‑field Fourier Transform Infrared (FTIR) micro‑spectroscopy—can reveal the same dielectric information if used cleverly. The idea is to place exfoliated flakes on a reflective substrate, such as gold, and shine normally incident infrared light whose polarization can be rotated. Light partially bounces at the top and bottom of the flake, forming a miniature Fabry–Pérot cavity. At certain frequencies, these multiple reflections cancel in a way that produces sharp minima, or “dips,” in the reflected intensity. The team demonstrates that, outside the material’s most strongly absorbing region (the so‑called Reststrahlen band), the position of each dip is directly linked to the real part of the refractive index along the direction of the light’s electric field. By measuring many flakes of different, accurately known thicknesses, each providing dips at different frequencies, they reconstruct how the refractive index changes across a broad spectral range—without heavy numerical fitting and without any prior model of the material.
Probing Both Directions in Anisotropic Crystals
Some van der Waals materials, like α‑MoO₃, behave very differently along different in‑plane crystal axes, bending and confining light more strongly in one direction than another. The method naturally extends to this case by rotating the polarization of the incoming beam. Aligning the electric field along one axis isolates the corresponding in‑plane dielectric component, because under normal incidence the reflected signal is insensitive to the out‑of‑plane response. For hyperbolic materials—where one in‑plane direction looks metallic while the other remains dielectric—the authors add a twist: they illuminate at 45 degrees relative to the crystal axes. In this configuration, the reflected light mixes both directions, and the resulting dips inside the strongly absorbing Reststrahlen band become dominated by the imaginary part of the index along the “metal‑like” axis. With modest numerical fitting, this lets them recover not just how strongly light is slowed but also how quickly it is damped inside the material.
Putting the Method to the Test
The researchers validate their approach on two workhorse mid‑infrared crystals. First, they study hBN, which looks the same in all in‑plane directions. Using eleven flakes ranging from 117 to 320 nanometers thick on gold, they measure reflectance spectra and extract refractive index values at multiple frequencies on both sides of the Reststrahlen band. Fitting a simple “Lorentz oscillator” model—characterizing a single dominant lattice vibration—they obtain parameters such as the vibration frequency, strength, and damping. These agree closely with previous state‑of‑the‑art results from both near‑field and far‑field techniques, with small overall fitting errors. Next, they tackle α‑MoO₃, which is strongly anisotropic. With thirteen flakes of varying thickness, they extract two distinct oscillator bands along one in‑plane axis and a single band along the other, again matching earlier, more elaborate studies. The method is precise enough to resolve subtle differences in resonance frequencies and losses that matter for designing ultra‑confined polariton devices.
What This Means for Future Infrared Technologies
This work shows that a standard infrared microscope, paired with careful analysis of reflectance dips from multiple flakes, can deliver high‑quality dielectric data that previously required specialized nano‑imaging setups. Because the technique works on small, mechanically exfoliated flakes and does not depend on a detailed model beforehand, it offers a practical route to characterizing new van der Waals crystals as they are discovered. Researchers can now more easily determine how these materials bend, store, and absorb mid‑infrared light, which in turn will accelerate the design of sensors, thermal emitters, and nanophotonic components that operate well beyond the limits of conventional optics.
Citation: Sarkar, M., Enders, M.T., Shokooh-Saremi, M. et al. Far-field extraction of the dielectric function of exfoliated flakes near phonon resonances. npj Nanophoton. 3, 11 (2026). https://doi.org/10.1038/s44310-026-00106-8
Keywords: mid-infrared materials, van der Waals crystals, phonon polaritons, dielectric function, FTIR microspectroscopy