Clear Sky Science · en
Multilayer networks characterize human-mobility patterns by industry sector for the 2021 Texas winter storm
Why this winter storm story matters
When a major storm hits, our movements change in ways that can mean the difference between safety and danger. This study looks at how people in Harris County, Texas, actually moved around during the 2021 winter storm that caused massive blackouts and damage. By tracing anonymous cell phone data, the researchers show which trips people gave up, which ones they held onto, and how well those patterns can be anticipated. Their approach could help cities prepare smarter for the next extreme weather event, making sure that critical places like grocery stores and gas stations stay accessible when they are needed most.
Following people through a frozen city
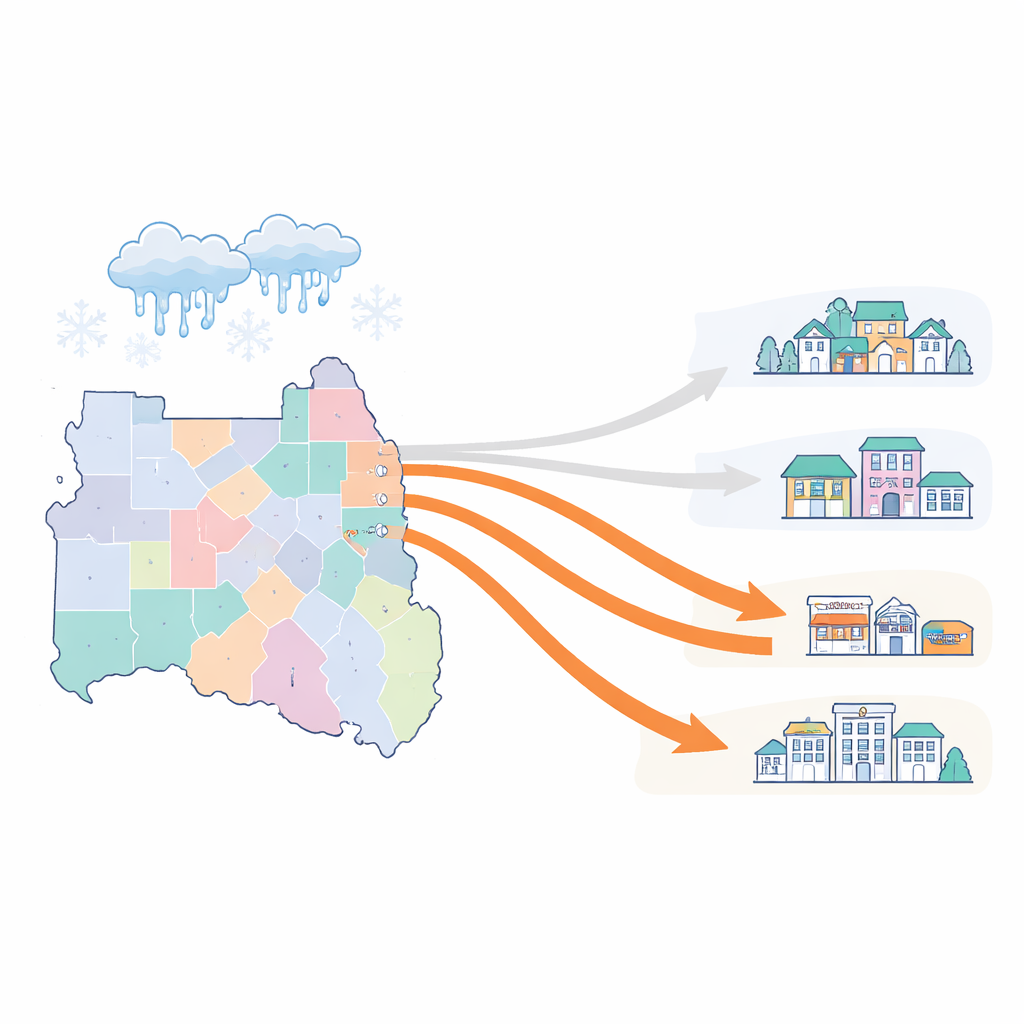
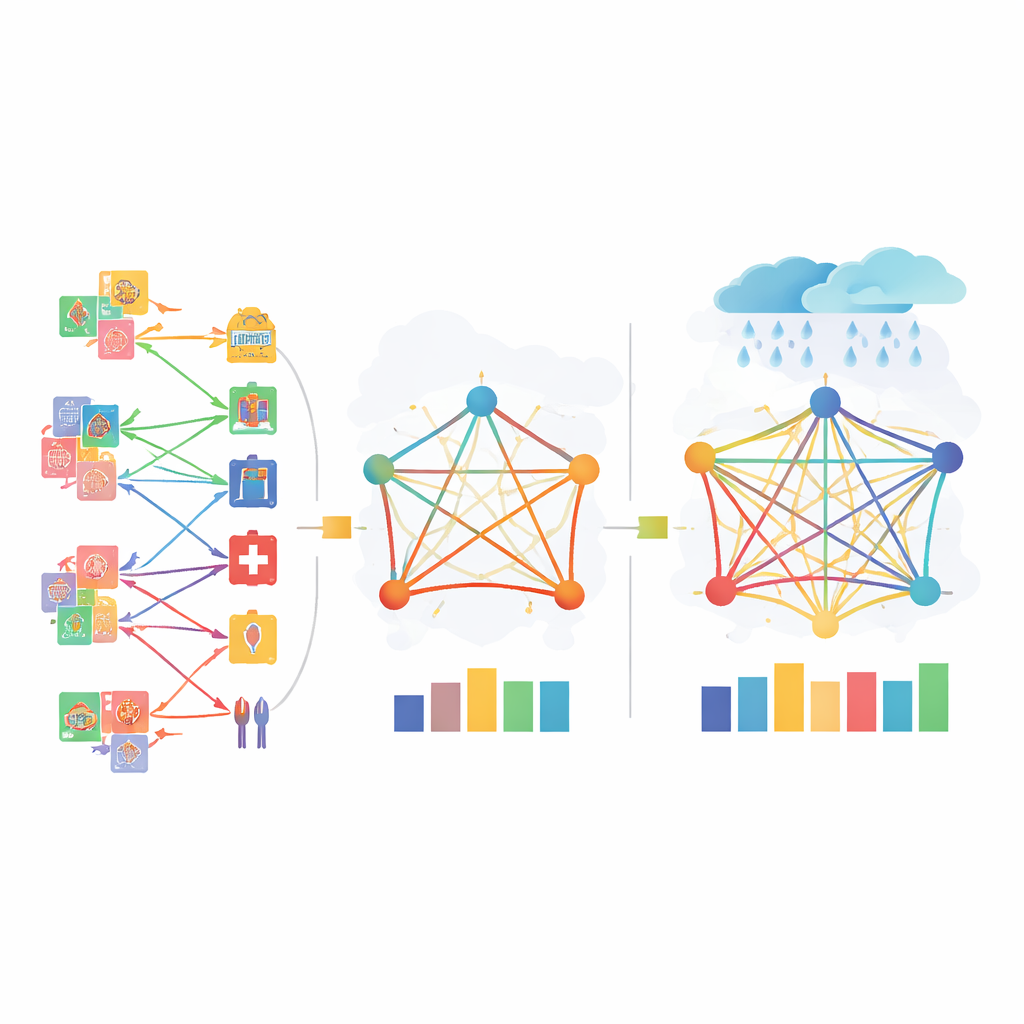
To understand storm-time behavior, the authors turned billions of GPS pings from smartphones into a map of weekly trips between neighborhoods. Each neighborhood is defined by a census tract, and trips are counted whenever people leave home and visit some place of interest, such as a school, restaurant, clinic, or store. Instead of treating all trips as the same, the team separated them into layers based on the type of destination, using a standard business classification system. One layer captures visits to health care sites, another to schools, another to restaurants, and so on. Stacked together, these layers form a kind of “mobility fingerprint” for the region, showing how different parts of everyday life contribute to overall movement.
Which trips disappeared and which stayed
By comparing the storm week to the six weeks just before it, the researchers measured how strongly each type of movement changed. Across the board, travel dropped sharply during the days when roads were icy, power was failing, and officials urged people to stay home. But the size of the drop differed by destination. Visits to ambulatory health care services, such as doctor and dentist offices and outpatient centers, fell the most, by more than thirty standard deviations below normal levels. Trips to restaurants and bars also plunged, as did visits to schools, especially elementary schools. In contrast, visits to grocery and other food stores barely declined, and trips to gas stations actually rose. A smaller rise appeared for home improvement and building supply stores, and for accommodations such as hotels, which can offer shelter when homes lose heat or water.
Looking closer at flows between neighborhoods
The team then studied how many trips flowed into and out of each neighborhood. Outgoing trips count how often residents of a tract travel elsewhere; incoming trips count how many visitors arrive from other tracts. Even during normal weeks, these flows are very uneven: some tracts send and receive many visits, while others see very few. The authors found that outgoing movement is strongly tied to how many people live in a tract, while incoming movement is better explained by how many businesses or services it contains. In other words, population mainly drives trips outward, and local infrastructure mainly attracts trips inward. During the storm, the overall levels of movement dropped and the distributions shifted downward, but the basic shapes of these patterns remained similar.
How predictable are our storm-time movements?
To test how well such flows can be anticipated, the researchers built simple statistical models that try to predict incoming and outgoing trips using neighborhood features. These features included population size and density, income, poverty and unemployment levels, racial makeup, and counts of different types of businesses. Models did a relatively good job predicting how many trips residents made outward from each tract, both in normal weeks and during the storm; accuracy changed by less than one percent during the crisis. Predicting incoming trips was harder. Even in normal weeks, models explained less of the variation, and during the storm their performance dropped further. The storm seemed to scramble which destinations attracted visitors, making inflows to specific areas less tied to usual social and economic patterns.
What this means for future disasters
Seen together, the findings paint a clear picture: in a severe winter storm, people dramatically cut out many optional trips, especially for dining, school, and non-emergency medical care, while working hard to preserve access to food, fuel, and certain supplies. Movements from home outward follow population and remain fairly predictable, but where people choose to go becomes much less stable under stress. For planners and emergency managers, this means that keeping essential stores and gas stations functioning and reachable should be a top priority, and that relying on normal patterns of where people congregate can be misleading during a crisis. The multilayer network approach introduced here offers a practical way to detect which kinds of movement matter most in an emergency and to design responses that match how people actually behave when the next storm arrives.
Citation: Butler, M., Khan, A., Afrifa, F.O.T. et al. Multilayer networks characterize human-mobility patterns by industry sector for the 2021 Texas winter storm. npj Complex 3, 15 (2026). https://doi.org/10.1038/s44260-026-00076-0
Keywords: human mobility, winter storm, disaster planning, cell phone data, urban resilience