Clear Sky Science · en
Development of the antimicrobial resistance burden score through a modified eDelphi
Why drug-resistant germs matter to all of us
Antibiotic-resistant infections are often described as a slow-motion pandemic. They already kill more people worldwide than HIV or malaria and threaten routine healthcare, from surgery to cancer treatment. Yet hospitals still lack a simple way to see how big their resistance problem really is, or whether their efforts to tackle it are working. This article describes the creation of a new hospital “AMR Burden Score” – a single yardstick that pulls together many strands of information about drug-resistant infections to show, at a glance, how serious the problem is and how it is changing over time.
Turning scattered clues into a single picture
Today, most tracking of antimicrobial resistance (AMR) relies on scattered statistics: how often certain bacteria are resistant, how much antibiotic is being prescribed, or whether staff follow prescribing rules. Each number tells only part of the story. A hospital might use many antibiotics but also treat very sick patients successfully. Another might appear to have low resistance simply because it does little testing. The researchers behind this study set out to design a more complete, standardised score that blends together infection data, patient outcomes, prescribing behaviour, staff training and even cost information. Their goal was a tool that hospitals and health systems could use to compare themselves over time and against similar institutions, and to see whether new policies are actually reducing AMR burden.
Asking experts to build the yardstick
To design the score, the team used a structured survey method called a modified electronic Delphi (eDelphi). Over three online rounds, 17 invited experts – including infectious disease doctors, microbiologists, pharmacists, public health specialists and health economists – rated and commented on potential ingredients of the score. They judged not only which measures mattered most, such as deaths linked to resistant infections or trends in resistance over time, but also how practical it would be for hospitals in different countries, especially lower- and middle-income ones, to collect the necessary data. Across the rounds, the experts refined both the list of measures and how heavily each should count.
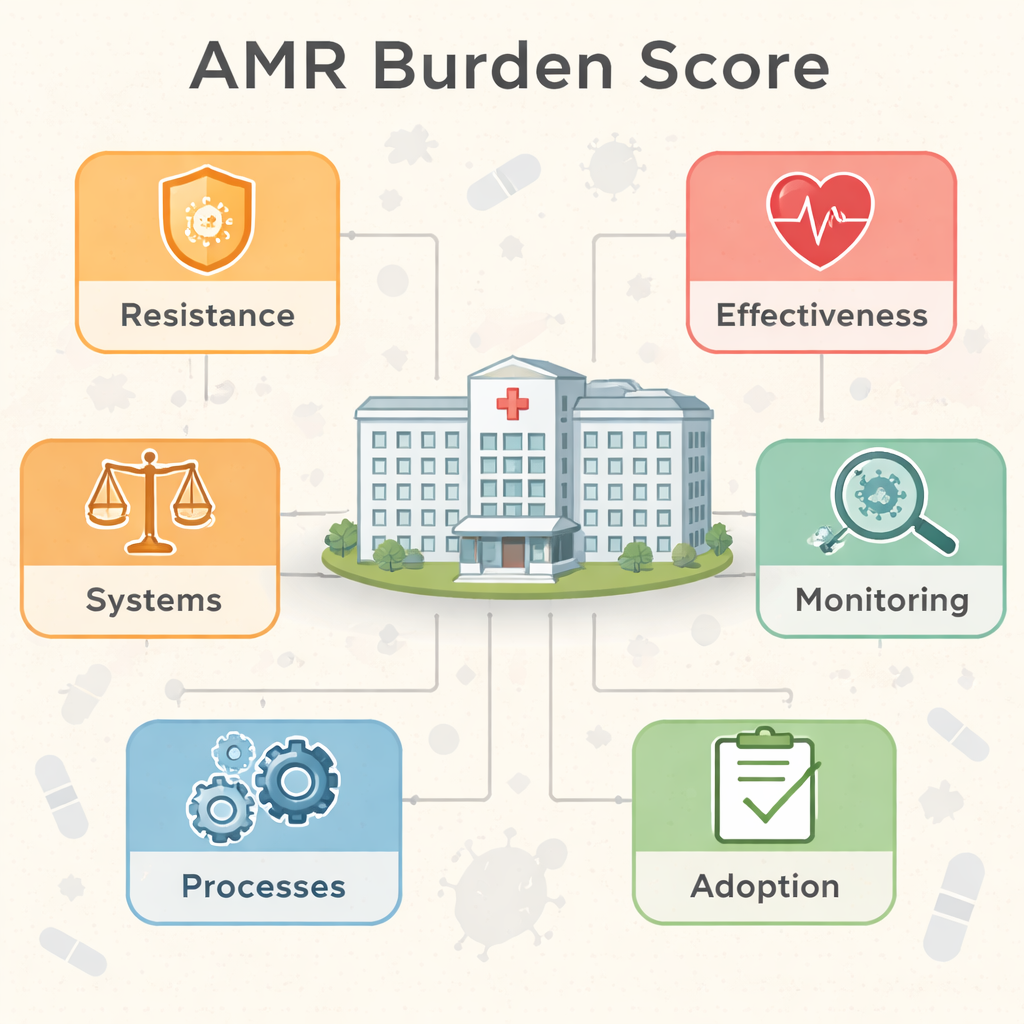
Six building blocks of the AMR Burden Score
The end result is a 100-point AMR Burden Score built from six weighted “domains”: Resistance (25%), Effectiveness (30%), Monitoring (30%), and three smaller ones—Adoption, Processes and Systems (5% each). The Resistance domain captures how common multi-drug resistant organisms are and how often key bacteria shrug off standard treatments. Effectiveness focuses on what this means for patients, including how long they stay in hospital, whether they receive the right drug quickly, and their risk of dying or relapsing. Monitoring looks at how wisely antibiotics are used, for example which types are chosen and whether doctors tailor treatment to lab test results. The smaller domains track how well decision-support tools are used, whether staff are trained in good antibiotic practice, and what resistant infections are costing the hospital.
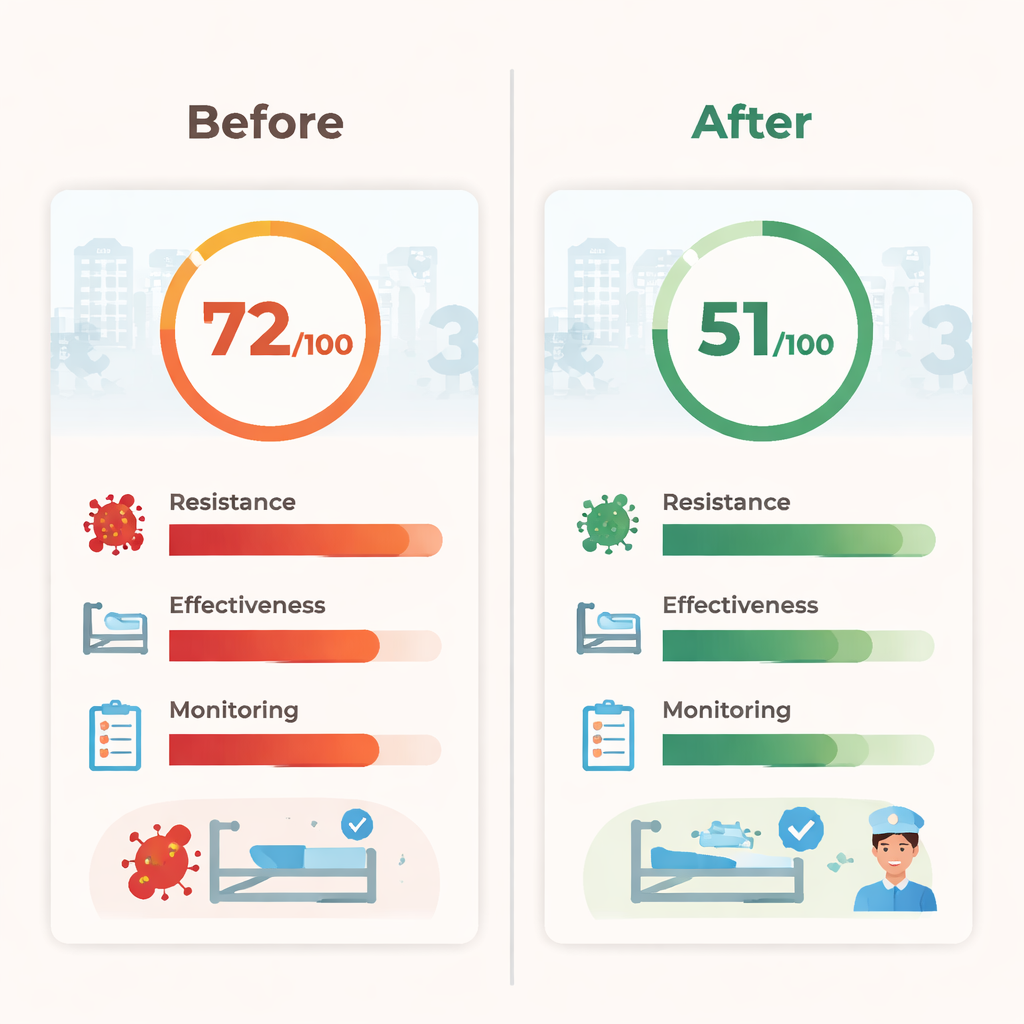
What the score can show hospitals
Using real hospital data, the authors illustrate how the score can highlight progress. In one example, a hospital’s overall score falls from 72 to 51 out of 100 after stewardship efforts, such as improving lab-guided prescribing and staff education. Behind that simple change lies a drop in the share of hard-to-treat infections, shorter extra hospital stays and lower death rates linked to resistance. Because each domain also receives its own sub-score, hospital teams can see not just that things have improved, but where: perhaps resistance is falling while monitoring still needs work. The authors argue that this makes the score useful both as a management dashboard and as a way to compare similar hospitals or regions.
Challenges and plans for the future
The researchers are open about the score’s limitations. Fewer experts completed the later survey rounds, especially health economists, which may have skewed how the cost-related parts were designed. Some specialists also worried that mixing “how bad the resistance is” with “how well the hospital is managing it” into one number could blur important distinctions. Data demands are another concern: many hospitals, particularly in low-resource settings, lack detailed electronic records. The authors therefore view this version of the score as a starting point. They suggest that future work should test it in real hospitals, simplify it for settings with less data, and explore advanced tools, such as machine learning and genetic sequencing, to sharpen its predictions.
What this means for patients and policymakers
For non-specialists, the AMR Burden Score can be thought of as a credit score for a hospital’s antibiotic resistance problem. A higher number signals a heavier burden: more hard-to-treat infections, worse outcomes, poorer monitoring and greater costs. A lower number indicates that resistant infections are rarer, caught earlier and managed more effectively. By turning scattered technical data into one clear metric backed by expert consensus, this tool could help hospital leaders, health agencies and governments see where action is most urgently needed and whether their efforts are paying off—an important step in keeping life-saving antibiotics useful for as long as possible.
Citation: Waldock, W.J., Gilchrist, M., Davies, F. et al. Development of the antimicrobial resistance burden score through a modified eDelphi. npj Antimicrob Resist 4, 15 (2026). https://doi.org/10.1038/s44259-026-00184-w
Keywords: antimicrobial resistance, hospital score, antibiotic stewardship, drug-resistant infections, healthcare quality