Clear Sky Science · en
A systematic exploration of digital biomarkers for the detection of depressive episodes in bipolar disorder
Why your phone and a ring might flag a downturn
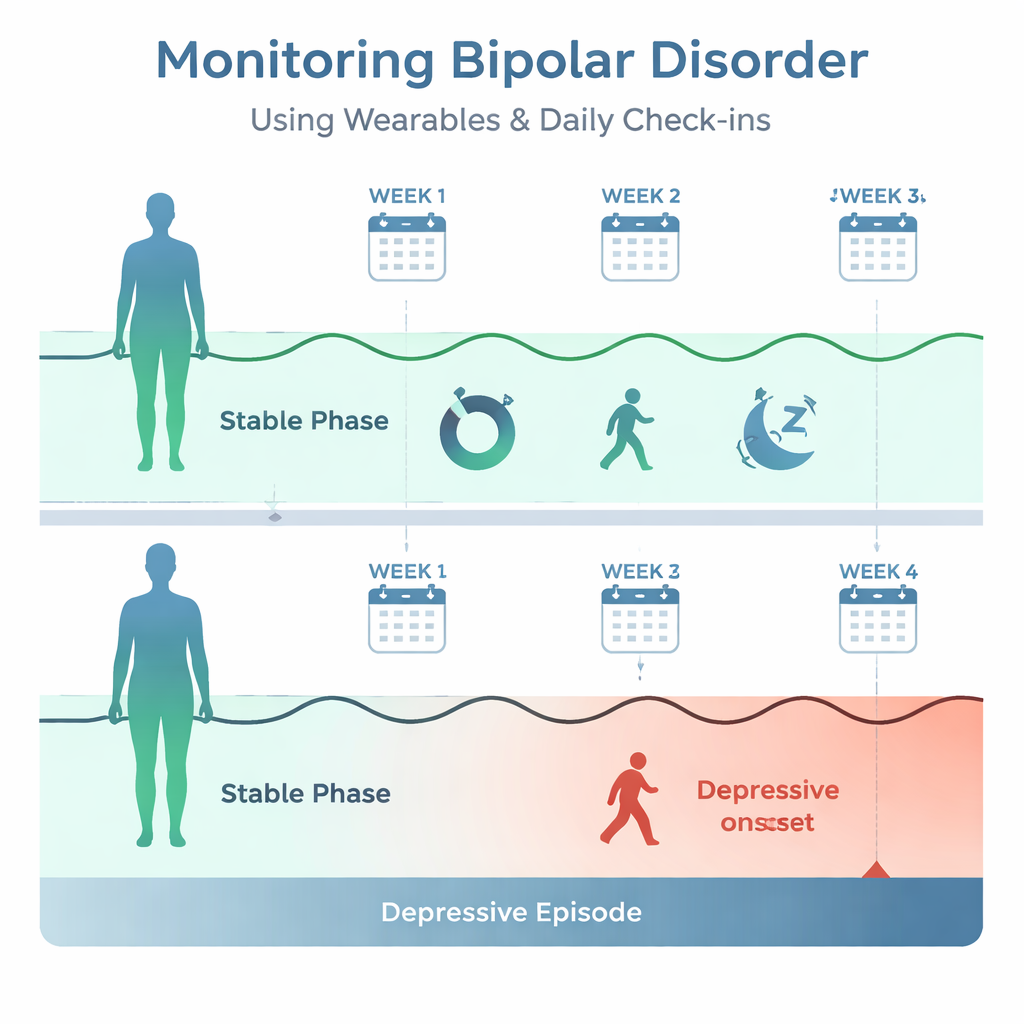
For many people living with bipolar disorder, depressive episodes can seem to arrive without warning, derailing work, relationships, and daily life. This study asks a simple question with far-reaching implications: can patterns in everyday data—from a wearable ring that tracks activity and sleep, plus very short daily mood check-ins—reliably signal when someone has slipped from a stable phase into depression? If so, technology people already carry could help patients and clinicians react earlier, long before a crisis forces treatment.
Following real life over months, not minutes
The researchers followed 133 adults with bipolar I or II disorder for a median of about eight months. Participants wore an Oura ring, a commercially available device that continuously records movement and sleep, and completed very brief daily ratings of their mood, energy, and anxiety via email. Once a week, they also filled out a standard depression questionnaire used in clinics. Using these weekly questionnaires, the team marked when a participant entered a depressive episode—defined as at least two weeks in a row with clinically significant symptoms—and when they were in a stable, or euthymic, state. This created long, detailed “streams” of behavior and feelings across good times and bad.
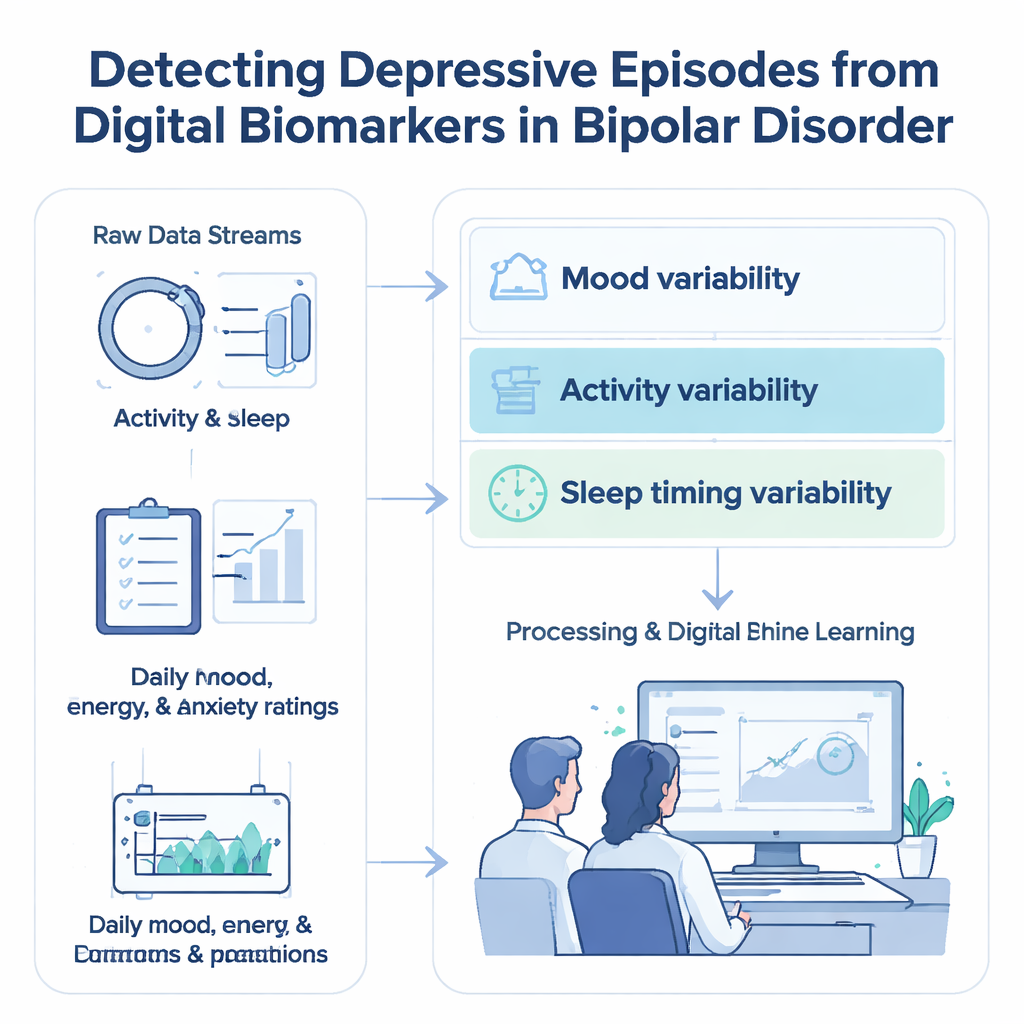
Turning thousands of data points into a few clear signals
From the raw data, the scientists engineered 49 basic variables (such as daily step-related activity, time to fall asleep, and average mood rating) across several time scales, and then extracted seven mathematical descriptors of how each variable behaved over time. These descriptors captured not just levels, but how much a measure wobbled from day to day, how extreme those swings were, and how similar one day was to the next. The result was 343 candidate “digital biomarkers” describing patterns in sleep, activity, and self-reported mood, energy, and anxiety. They then used explainable machine-learning methods—algorithms that can both classify patterns and reveal which inputs mattered most—to see which combinations best separated depressive days from stable ones.
What depression looked like in daily patterns
Among all the signals, daily self-ratings were the strongest single source of information. Models using only the three daily sliders for mood, energy, and anxiety distinguished depressive episodes from stable periods with high accuracy (an area under the ROC curve of about 0.82, where 1.0 is perfect and 0.5 is no better than chance). During depressive episodes, people rated their mood and energy clearly lower. At the same time, their scores fluctuated within a narrow low range—producing a statistical pattern the authors call a relative–absolute variability paradox: mood and energy looked more “variable” when measured relative to their low average, but in absolute terms people felt persistently low and “stuck.” In other words, depression here resembled a prolonged, flat valley rather than sharp ups and downs.
Subtle changes in movement and sleep still matter
Even without self-ratings, the wearable ring alone carried useful clues. Depressive episodes were linked to less day-to-day variation in overall activity—people’s movement levels were more uniformly low. Sleep patterns also shifted. The time it took to fall asleep varied more wildly from night to night, while measures of deep sleep tended to show fewer extreme swings. Although activity- and sleep-based models were less accurate than those using daily mood reports, they still outperformed chance and were robust across many statistical tests, suggesting that the body’s rhythms themselves become more rigid and less adaptable during depressive phases.
From description to early warning systems
The authors emphasize that this work is an early but crucial step: it focuses on accurately describing when a person is depressed, not yet on forecasting episodes before they start. Still, the picture that emerges is intuitively recognizable: during depressive episodes, people feel consistently worse and less energetic, move less and more monotonously, and experience more erratic bedtimes. Because the key digital biomarkers they identified are relatively simple—day-to-day variability in mood, activity, and time to fall asleep—they could eventually be built into apps or clinical dashboards. For patients, that might mean that a phone and a ring quietly track these patterns in the background and alert them and their clinician when their everyday rhythms begin to resemble past depressions, opening the door to timelier, more personalized care.
Citation: Halabi, R., Mulsant, B.H., Tolend, M. et al. A systematic exploration of digital biomarkers for the detection of depressive episodes in bipolar disorder. npj Mental Health Res 5, 13 (2026). https://doi.org/10.1038/s44184-026-00195-5
Keywords: bipolar disorder, digital biomarkers, wearable sensors, depression detection, digital phenotyping