Clear Sky Science · en
Time scales and gaps, Haar fluctuations and multifractal geochronologies
Reading Earth’s Story Between the Lines
Earth’s past is written in rocks, mud, and ice, but that story is full of missing pages. Layers are eroded away, cores break off, and some periods are recorded in exquisite detail while others are barely touched. This paper asks a simple but powerful question: what can we learn not just from the data we have, but from the way those data are unevenly spread through time—and from the gaps where there is no record at all?
Where the Record Is Thick and Where It Is Thin
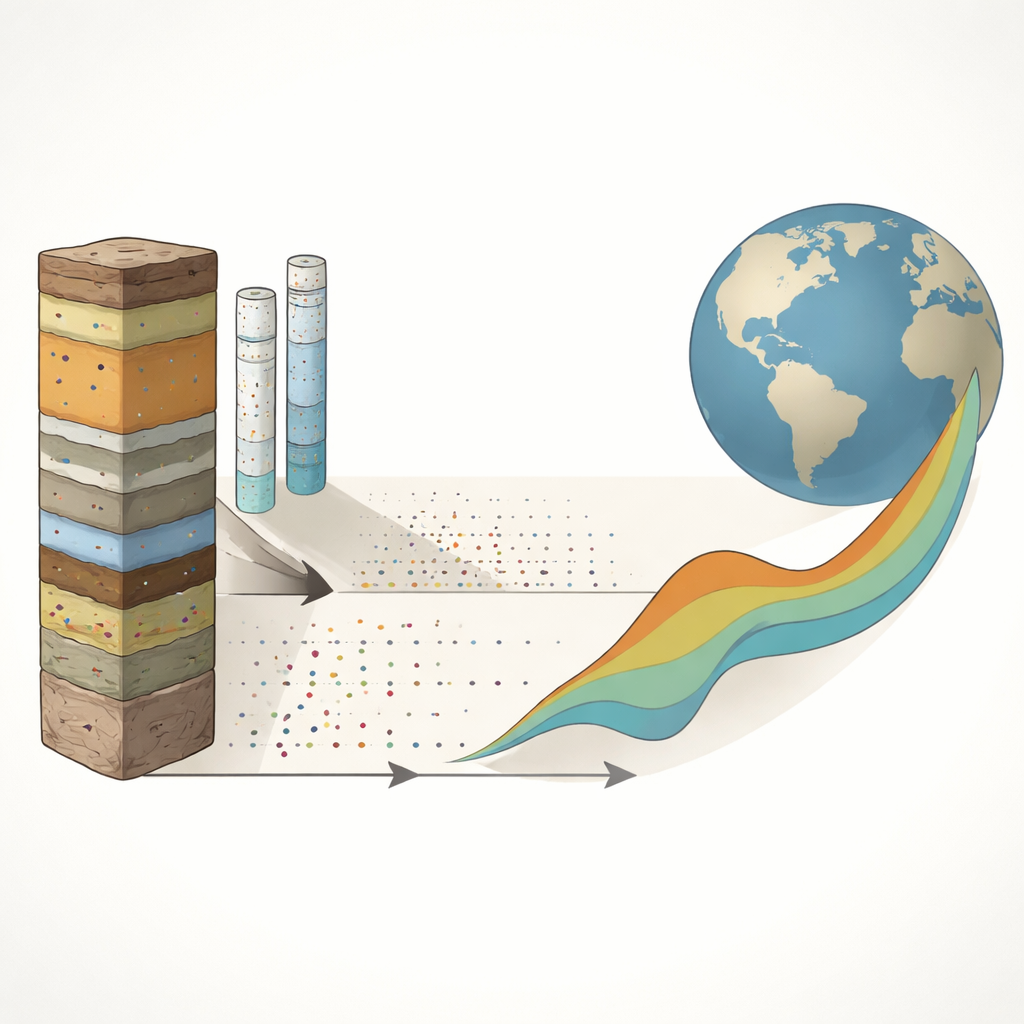
The authors collected 24 long-term records from around the world, spanning almost the whole history of the planet—from the last few thousand years back to more than three billion years ago. These records come from places such as lake and ocean sediments, ice cores, cave deposits, and fossil-bearing rocks. Instead of looking first at what these samples say about temperature or sea level, the team focused on how often measurements occur through time: how many data points per unit of time, which they call the measurement “density.” In some intervals, data points are packed tightly together; in others, they are sparse, revealing long stretches of missing information.
A New Way to Measure Unevenness
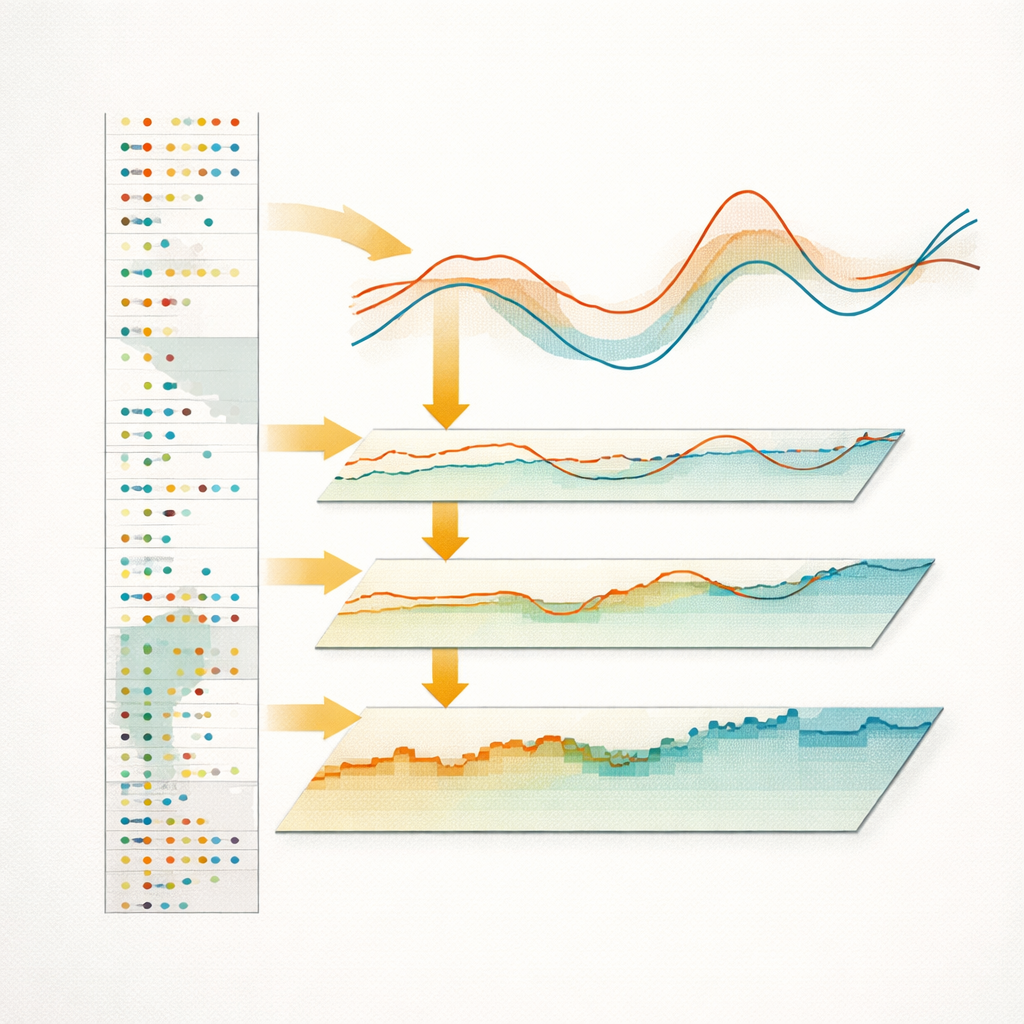
To explore this unevenness without forcing the data into a perfectly regular timeline, the researchers used a mathematical tool called Haar fluctuation analysis. In plain terms, they examined how the density of measurements changes as they zoom in and out across different time windows, from years to hundreds of millions of years. Across all datasets, they found consistent patterns. At shorter time scales, the measurement density tends to smooth out when you average over longer intervals, meaning that local gaps and clusters cancel each other. But beyond certain critical time scales, this changes: the density starts to drift and wander, and the average density itself becomes unstable. In this regime, the record is dominated by sharp bursts of intense sampling separated by large, poorly sampled stretches.
Gaps That Grow with the Length of the Record
The team then turned to the gaps themselves—the time intervals between successive measurements. At short intervals, these gaps behave in a fairly tame, “bell-shaped” way. At longer intervals, however, the gaps develop heavy “tails” in their probability distributions, meaning that extremely long gaps become more and more likely as records get longer. This provides a quantitative explanation for a long-known observation in geology: longer records are systematically less complete, a phenomenon known as the Sadler effect. In many cases, the longest single gap in a record can be comparable to the sum of all the smaller gaps, underlining just how fragmented our view of deep time can be.
When Data Density Follows the Climate
Another striking finding is that the density of measurements is often linked to the very climate indicators that scientists are trying to study, such as temperature or dust levels. At short time scales, fluctuations in measurement density and in climate proxies tend to be largely independent. But at longer scales, they become increasingly correlated. Periods with strong climate variability are more likely to be densely sampled, while quieter periods are often sparsely recorded. This means that the apparent patterns in reconstructed climate records can be biased: dramatic swings may be overrepresented simply because they are easier to detect and have attracted more study, whereas calmer intervals may be undersampled and underappreciated.
Seeing Value in the Empty Spaces
In the end, the paper argues that the “density” of measurements over time is itself a new kind of climate and Earth-history signal. It reflects the interplay of sedimentation, erosion, and human sampling choices, and it shares the same broad dynamical regimes as the climate system—from short-term “weather-like” variability through long-term “megaclimate” behavior over millions of years. By explicitly measuring how thick or thin our records are, and how the biggest gaps grow with the length of the record, scientists can both correct statistical biases in traditional analyses and extract fresh insight from the very places where data are missing. In other words, the authors show that the absence of evidence can be turned into evidence of how Earth’s changing environments shaped what was preserved—and what was lost—over billions of years.
Citation: Lovejoy, S., Davies, R., Spiridonov, A. et al. Time scales and gaps, Haar fluctuations and multifractal geochronologies. Commun Earth Environ 7, 208 (2026). https://doi.org/10.1038/s43247-026-03226-3
Keywords: paleoclimate records, geological time gaps, measurement density, stratigraphy, multifractal analysis