Clear Sky Science · en
Bridging glucose metabolism and intrinsic functional organization of the human cortex
Why brain energy matters to everyday thinking
The human brain is famously hungry for fuel, burning a large share of the body’s glucose even when we sit quietly with our eyes closed. Yet this energy is not used evenly across the cortex: some regions are power-hungry while others run relatively lean. This study asks a deceptively simple question with big implications for understanding health and disease: can we explain these regional energy costs from the way the brain is wired and synchronized at rest?
A map of quiet brain activity
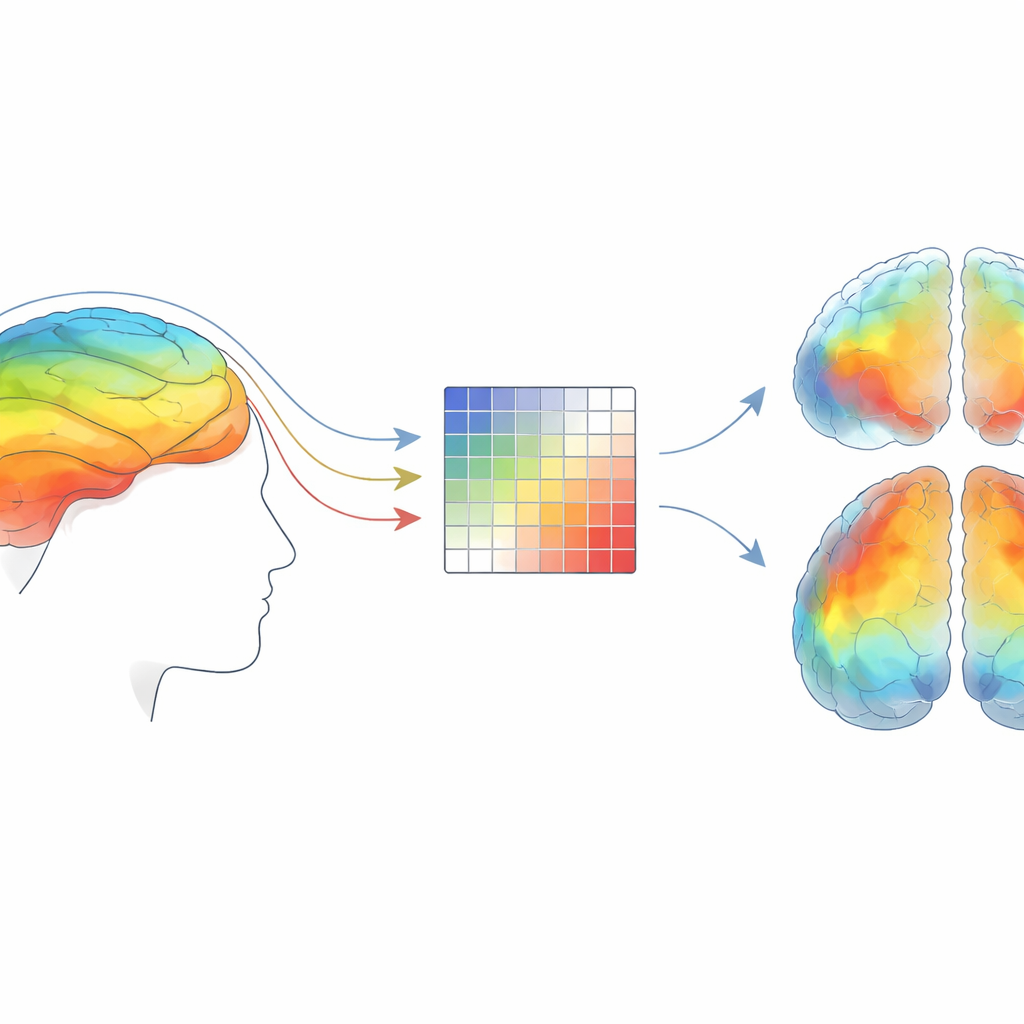
To tackle this question, the researchers combined two powerful brain-imaging methods. One, a form of positron emission tomography using a glucose-like tracer, shows where in the cortex cells are taking up more or less sugar, a proxy for how much energy they use. The other, resting-state functional MRI, tracks tiny fluctuations in blood oxygen that rise and fall together in different regions, revealing which areas tend to be active in concert even when a person is not doing any particular task. From these time-linked signals, the team built a map of how strongly each of 360 cortical regions is functionally connected to every other region.
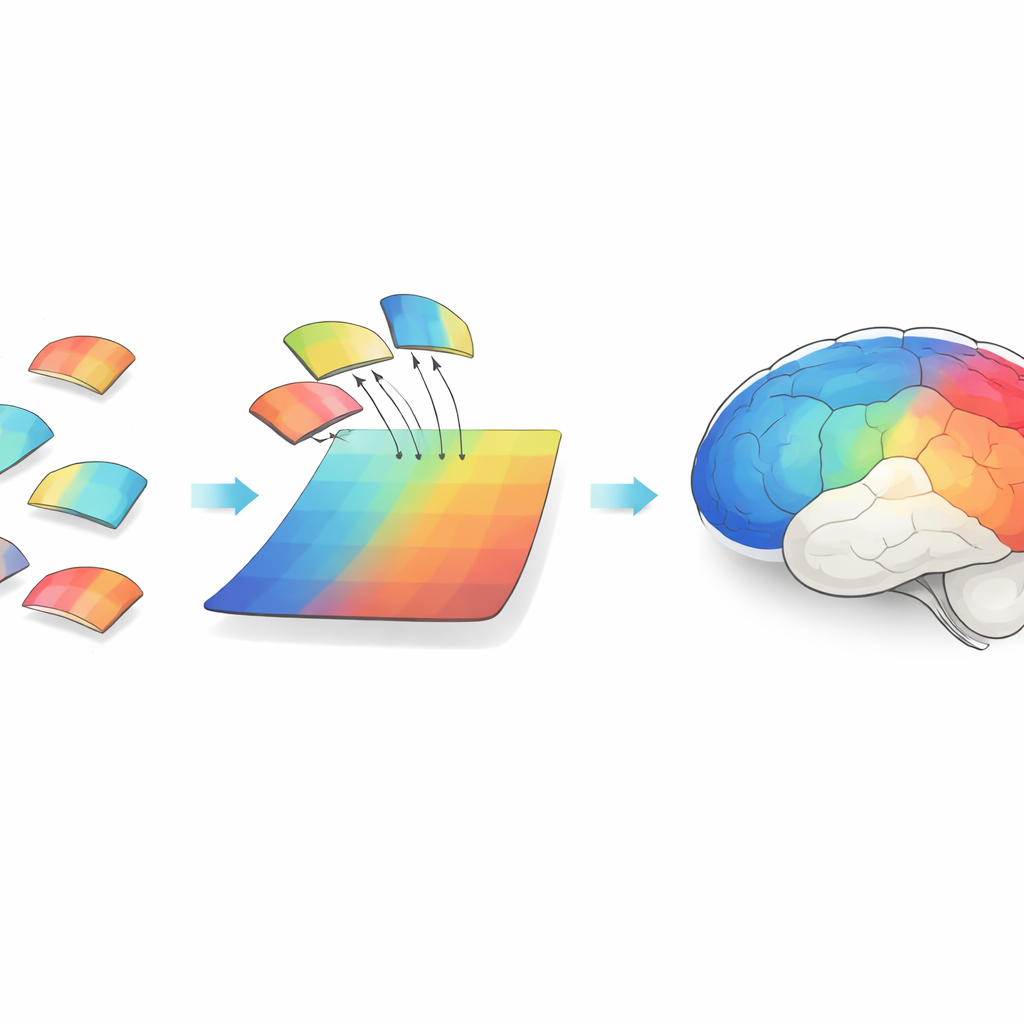
Squeezing complex wiring into simple patterns
The full connectivity map is extremely high-dimensional: each region has a long list of connection strengths with all others. Instead of treating every link separately, the authors used a mathematical technique that distills this tangle into a set of smooth “gradients” across the cortex. Each gradient is a broad axis along which neighboring areas have gradually changing connection profiles—for example, shifting from sensory regions that process incoming sights and sounds toward association regions involved in more abstract thought. By stacking many such gradients, they obtained a compact description of the brain’s intrinsic functional organization.
Predicting energy use from resting connections
The heart of the study was a series of models asking how well combinations of these gradients can reconstruct the cortex-wide pattern of glucose use. The researchers started with the first gradient alone, then gradually added up to 100 gradients. As more gradients were included, the models explained more of the variation in energy use across regions, rising steeply at first and then leveling off. With only five gradients, the model already matched or outperformed earlier approaches based on traditional network measures. With around sixty gradients, the models captured more than 70 percent of the regional differences in glucose uptake, suggesting a tight link between how areas are functionally embedded in the network and how much energy they consume.
Strong connections dominate the energy story
An important twist was that the researchers could tune how much weight to give weaker versus stronger functional connections when constructing the gradients. They found that gradients built mainly from the strongest connections were best at predicting energy use. Adding information from weaker links—by making the underlying connectivity matrix less sparse—did not improve the match to the glucose map. This pattern hints that the brain’s main energy demands are tied to its dominant communication routes, such as hub regions that coordinate information across distant networks, rather than to the multitude of faint, possibly redundant connections.
Left–right differences in energy and function
The team also explored whether the long-known functional differences between the brain’s two hemispheres show up in their energy organization. By computing separate gradients for the left and right hemispheres, aligning them, and comparing their ability to predict hemispheric patterns of glucose use, they found modest but detectable evidence that each side has its own partially distinct relationship between organization and energy. Models that treated the hemispheres independently fit the data better than those that forced them to share the same parameters. However, even the best models only explained about half of the asymmetry in energy use, and technical factors such as alignment challenges may blur the picture, so these findings are interpreted with caution.
What this means for understanding the brain
For a general reader, the key takeaway is that the brain’s energy budget is not random: it closely follows the large-scale layout of how regions communicate at rest. A handful of broad organizational axes, and especially the strongest functional links between regions, go a long way toward explaining why some cortical areas are metabolically costly and others more frugal. This provides a new framework for viewing the cortex as an energy-optimized landscape, where the wiring diagram and fuel use are tightly intertwined. In the future, such an approach could help scientists understand why certain networks are particularly vulnerable in neurological and psychiatric disorders that disrupt both connectivity and metabolism.
Citation: Wan, B., Riedl, V., Castrillon, G. et al. Bridging glucose metabolism and intrinsic functional organization of the human cortex. Commun Biol 9, 377 (2026). https://doi.org/10.1038/s42003-026-09693-w
Keywords: brain energy metabolism, functional connectivity, resting-state fMRI, FDG PET, cortical gradients