Clear Sky Science · en
Glioblastoma stem cells show transcriptionally correlated spatial organization
Why cell patterns in brain cancer matter
Glioblastoma is one of the most aggressive brain cancers, and survival has barely improved in decades. Many labs study special tumor cells called glioblastoma stem cells, which can regrow the tumor after treatment. In this study, researchers asked a deceptively simple question with big implications: can the way these cells arrange themselves in a dish—patterns you can see under an ordinary microscope—reveal what genes are active inside them, and potentially help speed up the search for new therapies?
Pictures that hold more than meets the eye
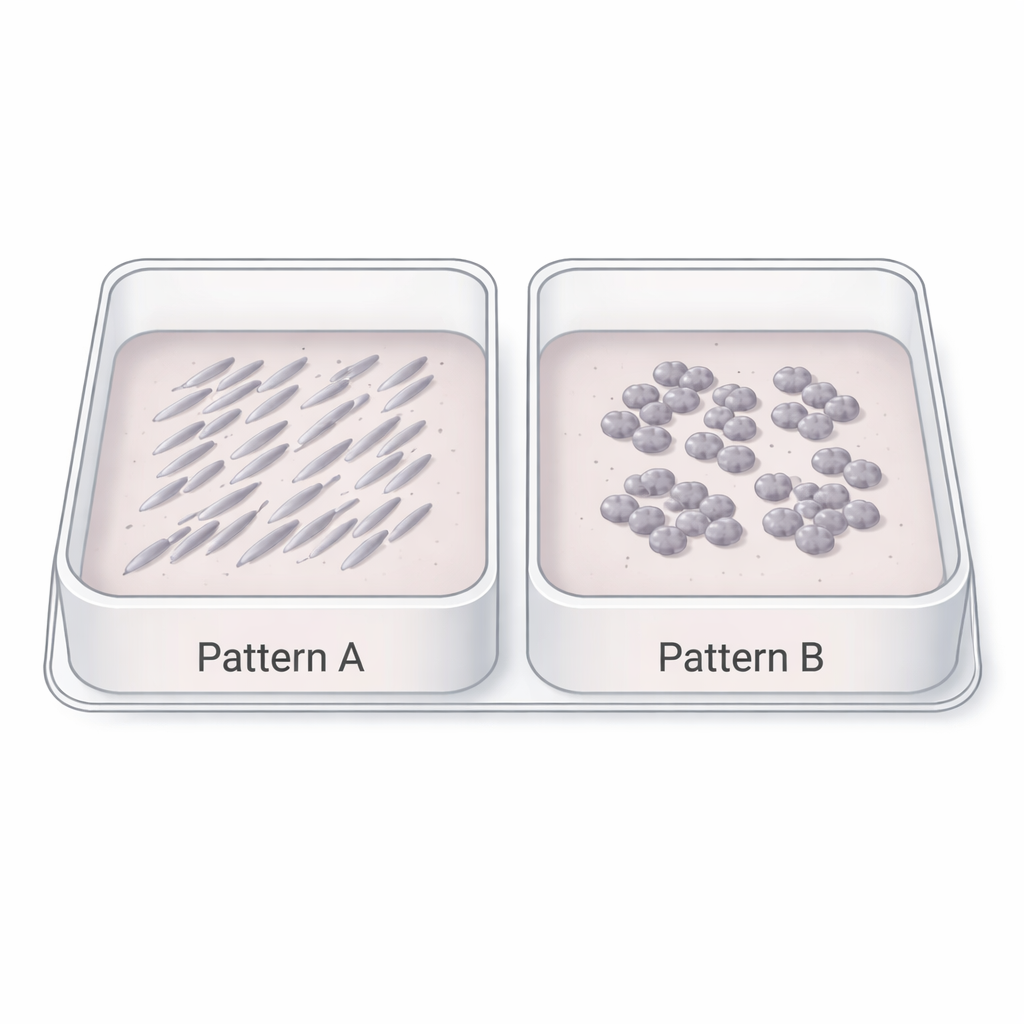
To explore this idea, the team collected about 17,000 time-lapse microscope images from 15 different patient-derived glioblastoma stem cell lines grown on flat plastic plates. These images, taken with standard phase-contrast microscopy, are similar to what many biology labs already generate every day. At first glance, the pictures simply show cells gradually filling the dish. But careful inspection revealed striking differences in how the cells organized: some formed long, aligned streaks of cells all pointing in similar directions, while others grew as rounder clumps with more random orientations or overlapping layers. These visual patterns hinted that the cells’ internal “personalities” might be written into their group behavior.
Translating textures into biology
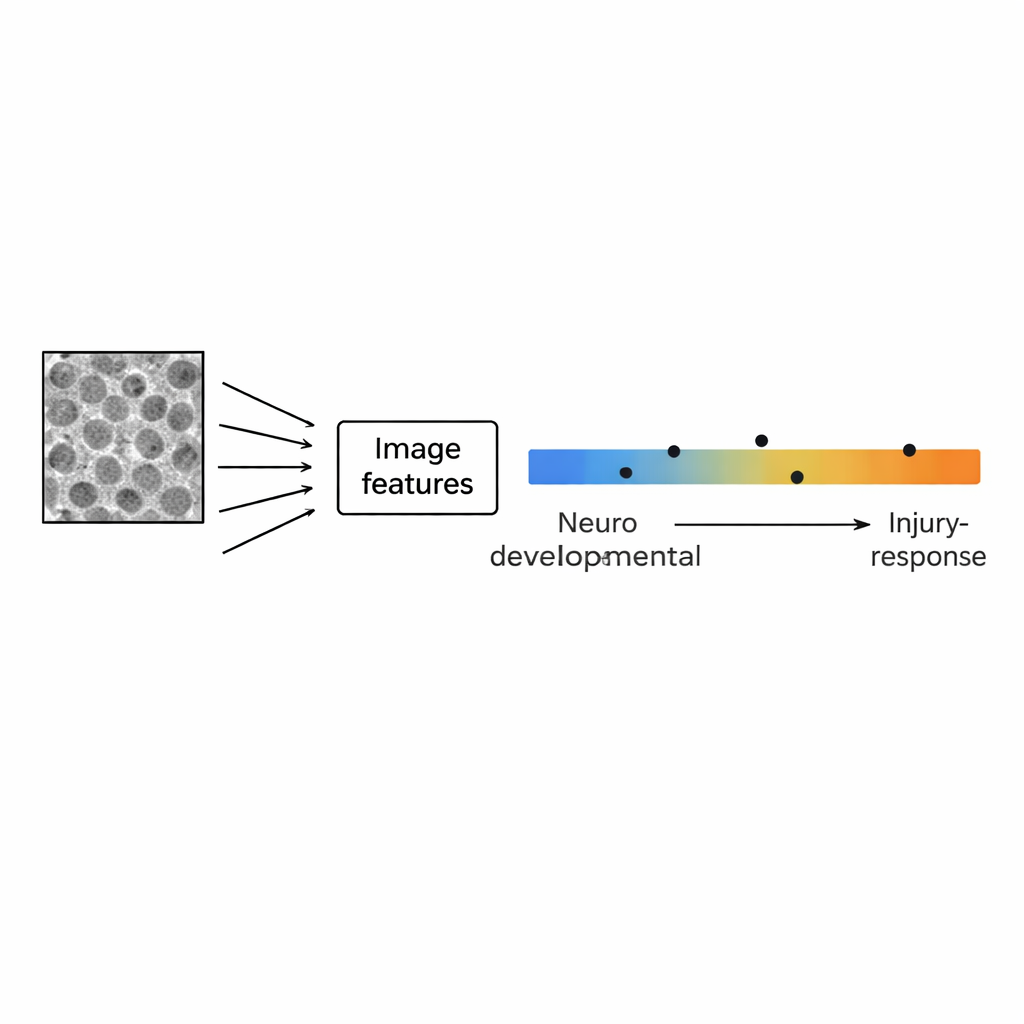
Instead of focusing on individual cells, the researchers treated each image as a whole pattern. Using open-source software, they converted every picture into 29 numerical features that describe texture and structure—such as how grainy the image is at different scales, how often neighboring pixels look similar, and how strong the contrast is in different directions. They then compared these image-based fingerprints to gene activity profiles from the same cell lines, using a set of 111 gene signatures that capture brain development, normal brain cell types and inflammation-related states. A statistical technique called principal component analysis revealed that the main axis of variation in image patterns tracked a known biological gradient: at one end, cells expressed genes linked to normal brain development (neurons, stem cells, supporting glial cells); at the other, they expressed genes tied to injury, inflammation and a more aggressive, “mesenchymal” behavior.
Patterns that persist as cultures grow
One challenge in interpreting cell images is that cultures change dramatically as they grow from sparse to densely packed. The authors addressed this by grouping images into nine levels of cell density and reanalyzing each level separately. Remarkably, the connection between spatial pattern and gene activity held across all growth stages: whether the plate was barely seeded or nearly confluent, images from more “developmental-like” lines tended to show smoother, more uniform textures, while those from injury-response lines showed more irregular, heterogeneous structures. However, the specific image features carrying the signal shifted with density—for example, measures capturing small-scale granularity were most informative at low densities, while features describing symmetry and homogeneity became more important as cells crowded together. This suggests that the underlying biology constrains how patterns evolve over time, even as the physical appearance changes.
From microscope snapshots to molecular predictions
To test whether images alone could predict a cell line’s position along the developmental–injury gradient, the team trained simple statistical models that used only the 29 image features as input and gene-expression-based scores as the “answer key.” A model that automatically selected the most informative combination of features accurately reproduced the gradient for the original 15 cell lines and showed encouraging agreement in four additional test lines. The most useful image features included both texture descriptors and measures of structure size, echoing what emerged from the pattern analyses. Importantly, this model worked with standard, label-free images—no fluorescent dyes or specialized microscopes were required—pointing to a practical route for turning routine imaging into a fast, inexpensive readout of cell state.
What this means for future brain cancer research
For non-specialists, the key takeaway is that how cancer cells look and arrange themselves as a community can serve as a window into the genes they are using. In glioblastoma stem cells, simple bright-field images capture enough information to distinguish cells that resemble normal developing brain from those shifted toward an injury- and inflammation-driven state, which is often linked to more aggressive disease. In the future, this kind of image-based “fingerprinting” could help scientists rapidly screen drugs or genetic changes by watching how they nudge cells along this gradient, without needing to sequence RNA every time. More broadly, the work hints that the architecture of living cell cultures is not just visually interesting—it encodes biologically meaningful information that can be decoded with the right tools.
Citation: Ayyadhury, S., Sachamitr, P., Kushida, M.M. et al. Glioblastoma stem cells show transcriptionally correlated spatial organization. Commun Biol 9, 208 (2026). https://doi.org/10.1038/s42003-026-09566-2
Keywords: glioblastoma stem cells, cell imaging, spatial organization, gene expression, high-throughput screening