Clear Sky Science · en
haCCA: multi-module Integration of spot-based spatial transcriptomes and metabolomes
Why mapping molecules in place matters
Our bodies are built from countless tiny neighborhoods of cells, each with its own mix of active genes and chemical substances. Until recently, scientists had to study these molecules after grinding tissue into a uniform paste, losing all sense of “where” things were. This paper introduces a new computational method, called haCCA, that stitches together two powerful imaging techniques so researchers can see, in situ, how genes and small molecules are arranged across real tissues and tumors. That kind of map can reveal hidden disease patterns and suggest more precise treatments.
Two different views of the same tissue
The study focuses on combining data from two spatial methods that are increasingly used in biology. Spatial transcriptomics records which genes are turned on at thousands of tiny spots across a tissue slice. MALDI mass spectrometry imaging records the amounts of many small molecules, such as metabolites and lipids, at similarly dense grids of spots. The catch is that these two instruments don’t measure the exact same positions or the same set of features, so their data are like two misaligned maps with different legends. Existing approaches mostly try to match the shapes of tissue sections based on their coordinates alone, which can be imprecise and lack a way to check how well the alignment actually worked.
A smarter way to line up molecular maps
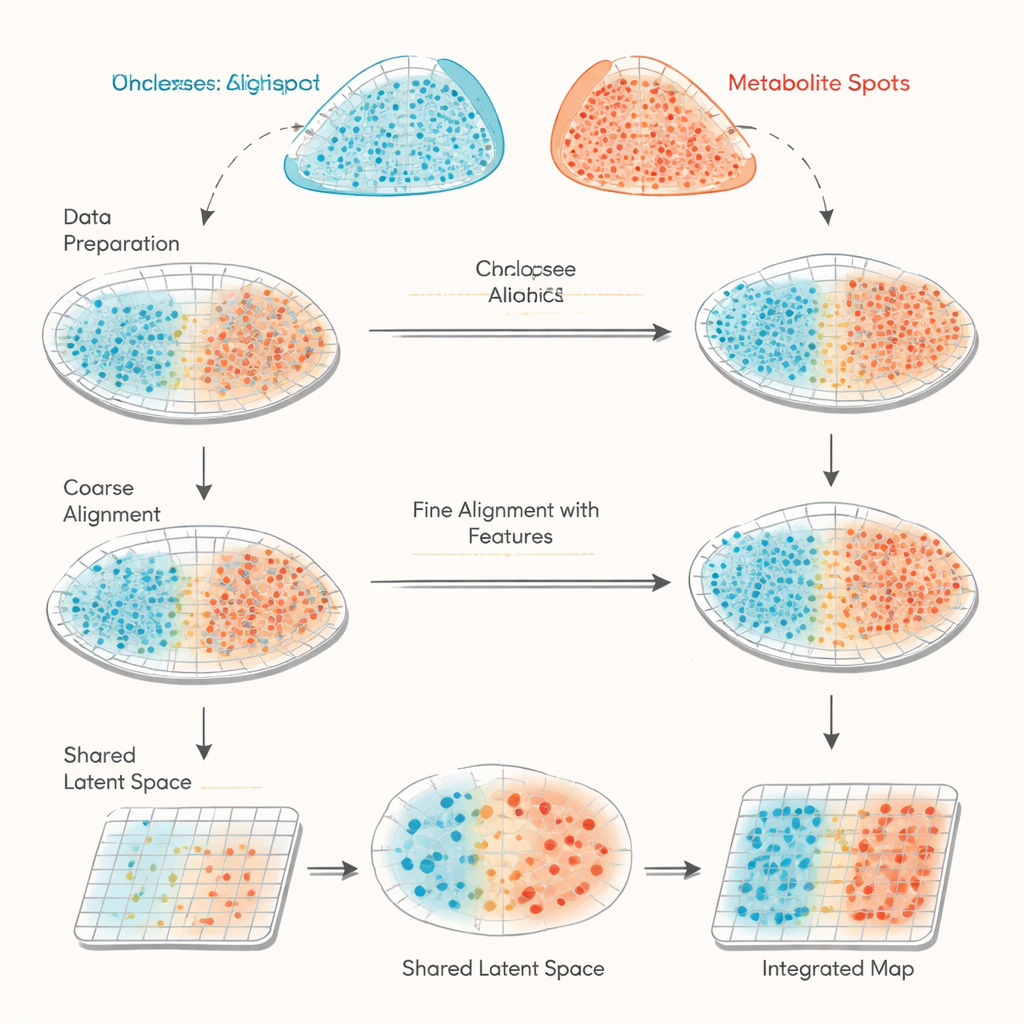
haCCA (short for hierarchical anchor-guided canonical correlation analysis) tackles this challenge by combining geometry with biology. First, it performs a two-step “morphological alignment” of the spot grids from the two technologies. Human experts pick a few matching landmarks on the tissue images to roughly correct for shifts and rotations, and then an automated step fine-tunes outliers near torn edges or missing pieces. Next, the method looks for “anchor” pairs of spots that are close in space and sit in locally uniform regions, making them likely to represent the same tissue area. From these anchor spots, haCCA calculates which genes and metabolites tend to change together and distills them into a shared low-dimensional representation that captures their strongest joint patterns.
Turning correlations into a unified tissue picture
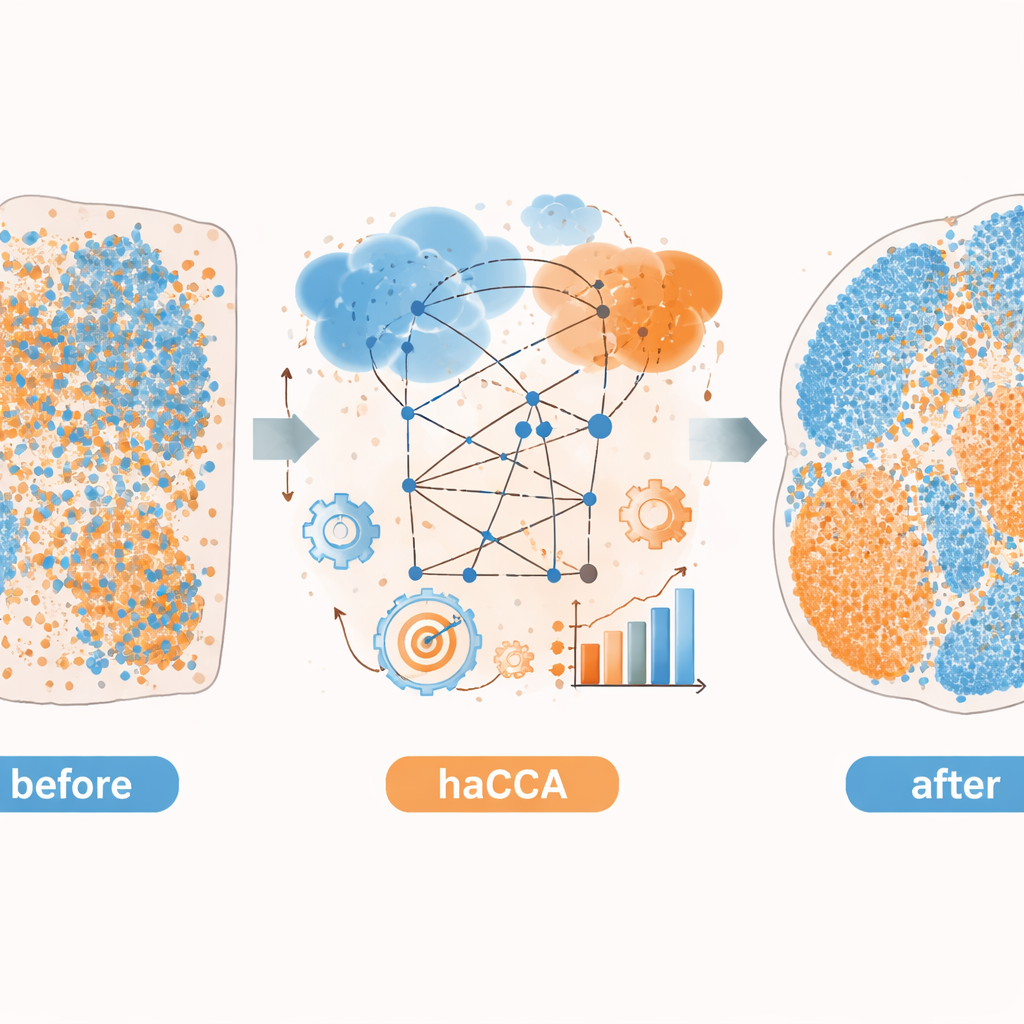
With both spatial coordinates and the shared molecular representation in hand, haCCA solves an optimization problem to decide how likely each gene spot should be matched to each metabolite spot. This step is designed to keep spots close in space but also similar in their combined gene–metabolite profile. The end result is a “transport plan” that links each point in one dataset to its best partner in the other, producing an integrated multi-modal map. On carefully constructed test data—where the true relationships are known—the authors show that each stage of the workflow (coarse alignment, refined alignment, and feature-aware matching) steadily improves three independent measures of accuracy. Compared with other tools that rely mainly on geometry, haCCA consistently achieves higher alignment and more faithful transfer of region labels.
Revealing hidden biology in brain and liver cancer
The authors then apply haCCA to real mouse brain and liver tumor tissues. For the brain, they integrate commercial spatial transcriptomics data with metabolite images from the same or neighboring sections. The method preserves known metabolic territories and reconstructs expected overlaps, such as the co-localization of dopamine with the gene encoding its key enzyme. By jointly clustering genes and metabolites, they find that the combined data tease apart more nuanced tissue subregions than either modality alone. In a preclinical model of intrahepatic cholangiocarcinoma, a type of liver cancer, they use haCCA to compare tumors that can or cannot form neutrophil extracellular traps—web-like structures released by immune cells. The integrated maps reveal that, when these traps are present, a gene called Scd1 and its associated fatty acids are enriched in malignant regions, pointing to a shift toward altered fat metabolism in the tumor.
What this means for future research
In everyday terms, haCCA is like lining up aerial photos taken with different cameras—one sensitive to building outlines, the other to heat signatures—to get a sharper picture of what is happening in each city block. By accurately merging where genes are active with where key metabolites accumulate, this workflow helps scientists profile both sides of cellular behavior at once: instructions and the resulting chemistry. The approach improves on earlier alignment methods, is packaged in an accessible Python tool, and can be extended to other spatial technologies. As such integrated maps become more routine, they could deepen our understanding of how tumors and other tissues organize their metabolism, respond to treatment, and evolve over time.
Citation: Xu, J., Shen, XT., Zhang, C. et al. haCCA: multi-module Integration of spot-based spatial transcriptomes and metabolomes. Commun Biol 9, 248 (2026). https://doi.org/10.1038/s42003-026-09526-w
Keywords: spatial multi-omics, transcriptomics, metabolomics, tumor metabolism, data integration