Clear Sky Science · en
Computational epitope heterogeneity analysis in immunostainings from antibody-dilution series
Why antibody staining quality matters
From tracking cancer cells to diagnosing infections, modern biology leans heavily on antibodies that “light up” specific molecules inside cells. Yet many labs quietly struggle with a nagging problem: stains that are too weak, too noisy, or just plain misleading. This paper introduces a practical, computer-based way to read more information out of a routine antibody-dilution series, helping researchers tune their staining for cleaner images, more trustworthy measurements, and even new ways to stain several targets in a single color channel. 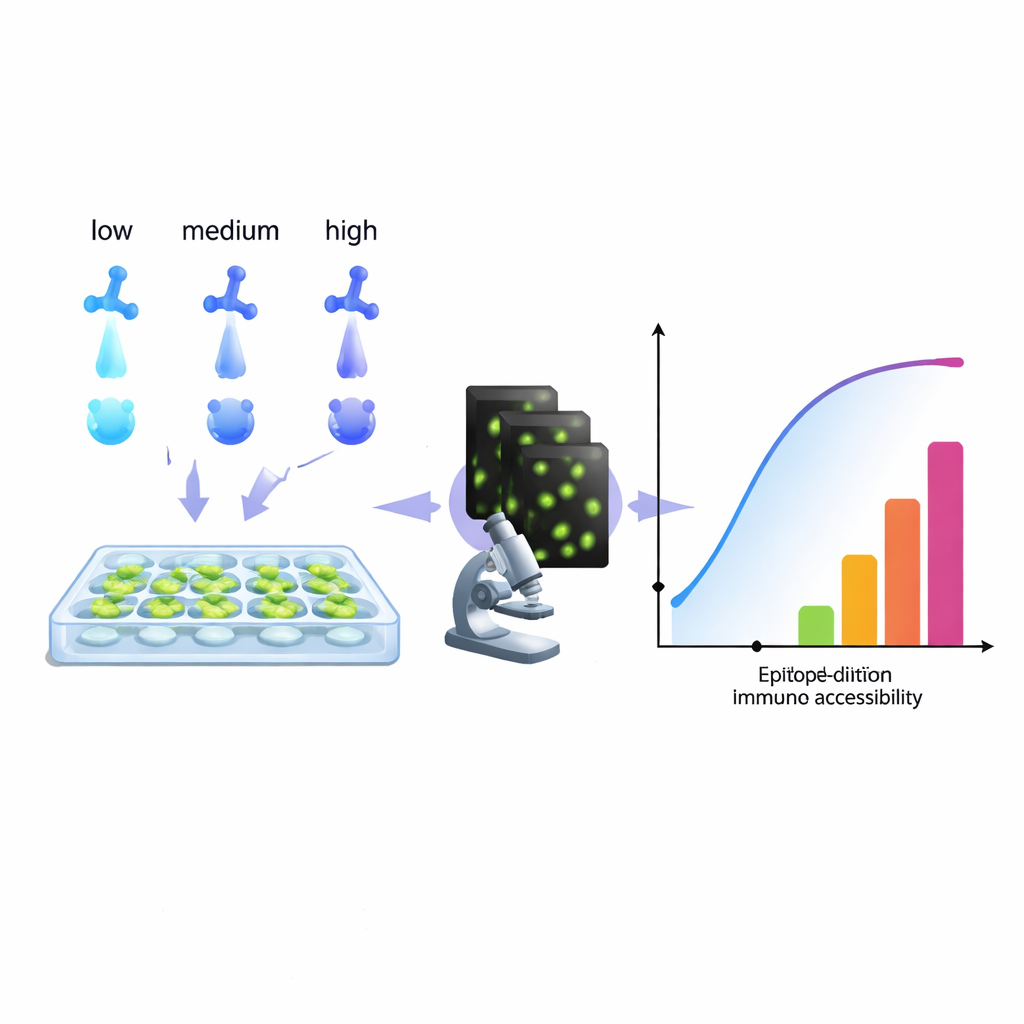
How scientists usually tune antibody stains
When researchers set up an immunostaining experiment, they typically guess an antibody concentration from the datasheet, try a few dilutions, and pick the one that “looks good.” Behind the scenes, though, countless tiny factors—protein shape, crowding inside cells, pH, and how well the antibody can wiggle into place—decide whether an antibody sticks or washes away. Traditional tools that measure antibody binding, such as surface plasmon resonance, work best on purified proteins on artificial surfaces, not on densely packed cells or tissues. That means the numbers they provide may not match the real biological system where the antibody is actually used. As a result, labs may unknowingly choose concentrations that boost fuzzy background or hide important, but less accessible, targets.
Turning simple dilution series into ‘accessibility maps’
The authors propose a different approach: treat a standard antibody-dilution series as a rich data set and fit it with a model that reflects what imaging actually sees—antibodies that stay bound even after repeated washing. By analyzing how the signal grows across concentrations, their algorithm reconstructs an “accessibility histogram.” Instead of trying to isolate pure chemical binding constants, this histogram groups target sites into technical “epitope classes” based on how easy they are to stain under real conditions. A single biological epitope might appear in multiple classes if, for example, it is easy to reach on one part of a cell and harder in a crowded region. Crucially, this method works directly with the microscope readout, without needing purified proteins or extra hardware, so any lab that can run a dilution series and quantify fluorescence can, in principle, build such histograms. 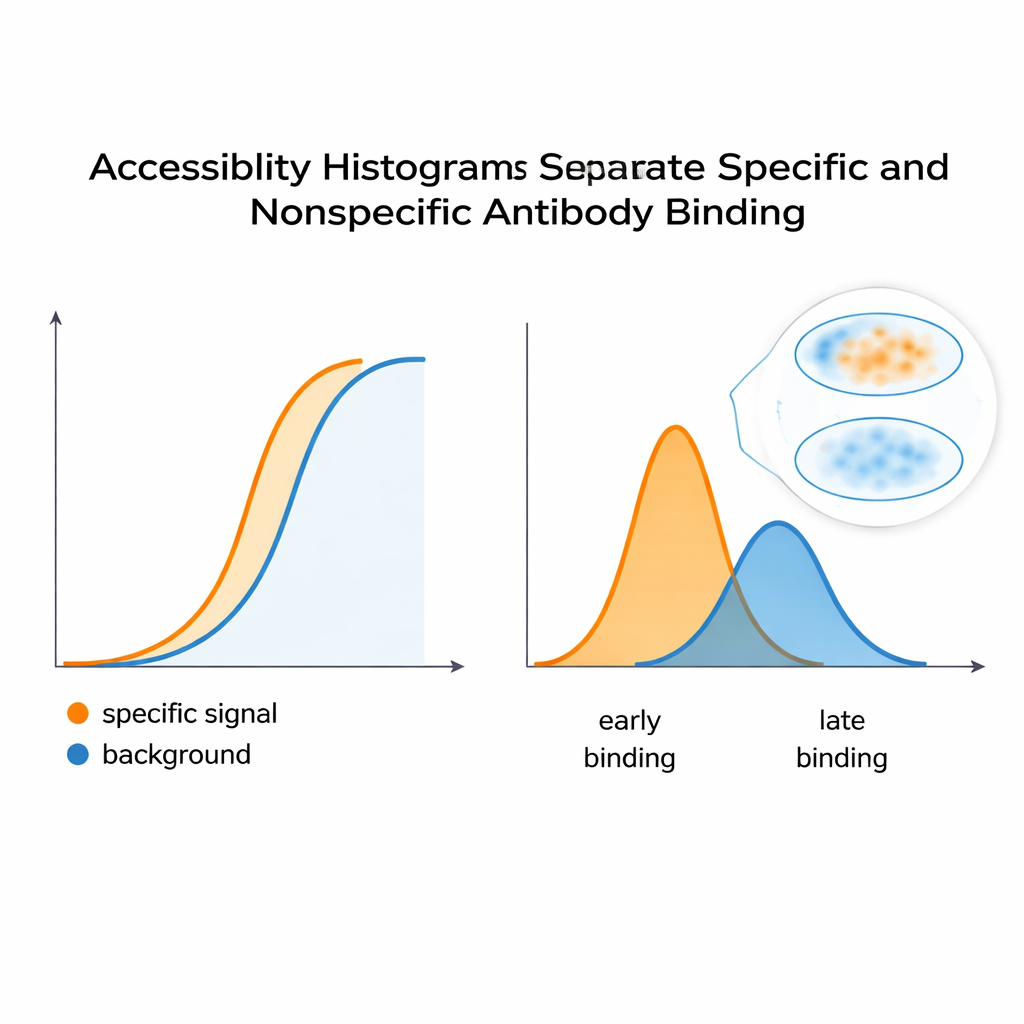
Separating real signal from background
To test whether these histograms really capture staining behavior, the team built a controlled system using HeLa cells and two monoclonal antibodies: one that mimics a desired, specific signal and another that acts like an unwanted background. When mixed together, the combined fluorescence curve looked like a single, smooth response—nothing obvious hinted at two distinct contributors. But the computational analysis split this curve into separate peaks in the accessibility histogram, revealing at least two underlying epitope classes. A similar strategy applied to an antibody that recognizes a shape-sensitive site on a PKA regulatory subunit showed that changes in protein conformation—triggered by a molecule called cAMP—shifted the distribution of accessible epitopes. This suggests the method can flag when protein structures open or close, altering how easily antibodies can bind inside cells.
Picking better dilutions and staining more with one color
Because each peak in the accessibility histogram contributes mainly over a certain concentration range, the authors use these peaks as a guide to choose “sweet spot” dilutions. Low-accessibility peaks that appear only at very high antibody levels are likely to include nonspecific binding, while early peaks often reflect the intended target. By modeling how individual peaks build up the overall dose–response curve, the team can suggest dilutions that maximize specific signal before problematic peaks kick in—sometimes far more dilute than vendor recommendations. They further extend this idea into a clever form of “computational multiplexing.” By staining the same fixed sample repeatedly with carefully chosen concentrations, imaging after each round, and subtracting earlier images from later ones, they isolate signals linked to different accessibility classes, effectively teasing apart multiple targets within a single fluorescence channel.
What this means for everyday lab work
In plain terms, this work turns a routine troubleshooting step—running an antibody-dilution series—into a quantitative tool. The accessibility histograms help scientists spot hidden complexity in their stains, pick dilutions that cut down on misleading background, and, in some cases, separate overlapping signals without needing extra fluorescent labels. While the underlying model is intentionally simple and does not capture every molecular detail, it is designed to be easy to use and robust enough for real-world data. If adopted widely, this approach could make antibody-based techniques—from basic imaging to diagnostic assays—more reliable, more informative, and less reliant on trial and error.
Citation: Tschimmel, D., Saeed, M., Milani, M. et al. Computational epitope heterogeneity analysis in immunostainings from antibody-dilution series. Commun Biol 9, 238 (2026). https://doi.org/10.1038/s42003-026-09517-x
Keywords: antibody staining, immunofluorescence, epitope accessibility, dose response, computational multiplexing