Clear Sky Science · en
Quantification of PET activation in adipose tissue from non-contrast CT scans
Why scanning fat without extra radiation matters
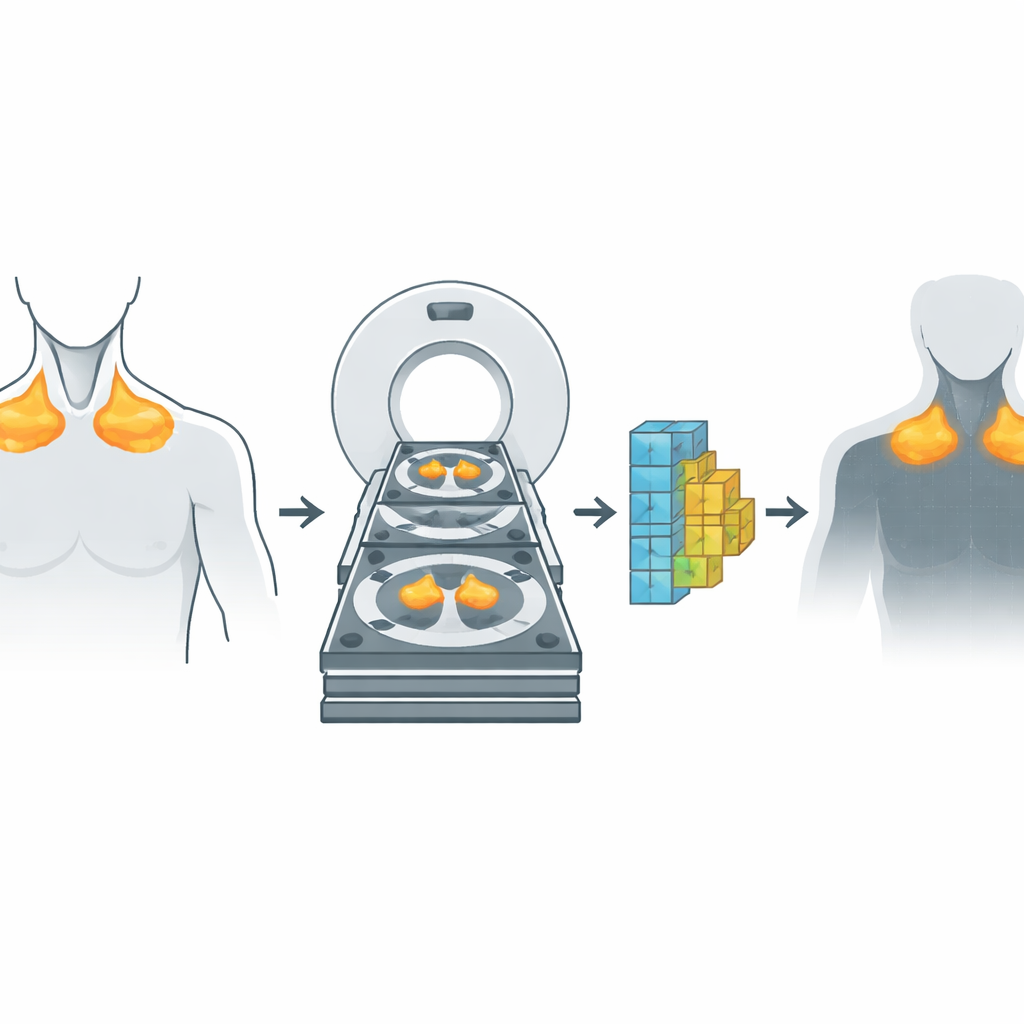
Doctors know that not all body fat is the same. A special kind called brown fat helps burn energy and is linked to better heart and metabolic health. The best way to see how active this fat is currently requires a PET scan, which is expensive, time‑consuming, and adds extra radiation. This study asks a simple but powerful question: can we get similar information from the ordinary CT scans that many patients already undergo, using artificial intelligence to “fill in” the missing metabolic picture?
Two kinds of scans, one smarter picture
PET and CT scans capture very different information. CT shows detailed anatomy: bones, organs, and fat structures at high resolution. PET shows function, highlighting where cells are consuming sugar, a sign of metabolic activity. Traditionally, doctors rely on PET to spot active brown fat because it lights up strongly when it burns fuel. The researchers brought these worlds together by collecting paired PET/CT scans from two groups of adults—one designed to study brown fat and another made up of patients with lung cancer. For each person, they carefully lined up the PET and CT images so that every point in the body matched in both structure and function, paying special attention to fat in the neck and around the upper chest aorta, where brown fat is commonly found.
Teaching a neural network to imitate PET
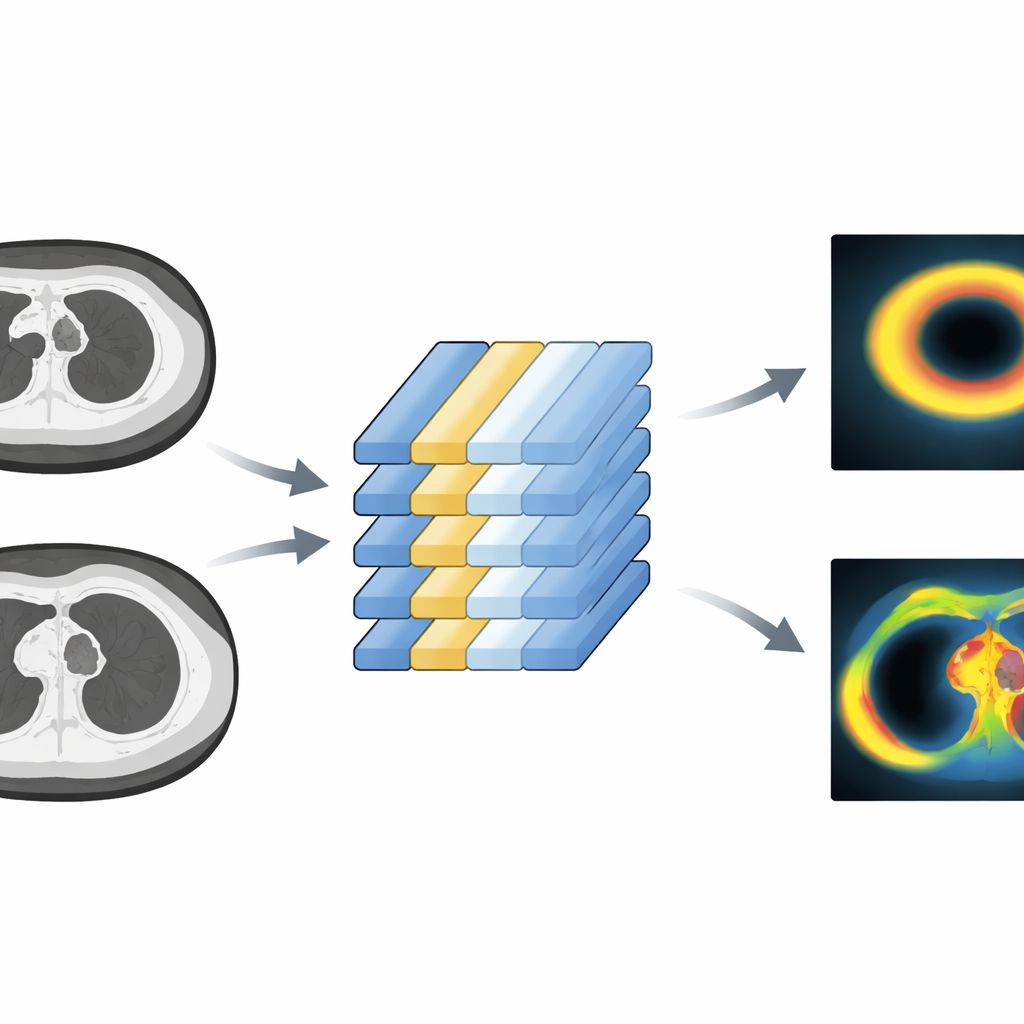
With these paired images, the team trained a type of deep learning model called a conditional generative adversarial network. In essence, they asked the network to look at a stack of CT slices and generate what a PET image would look like in the same region. The model was tuned to pay attention only to fat, isolating tissue within the density range typical of adipose tissue. By forcing the system to focus on fat alone, they reduced distractions from nearby structures such as the heart, lymph nodes, or tumors. They also evaluated different training strategies: building one model from the brown fat cohort, a second from the lung cancer cohort, and a third that combined both, to see how well each approach generalized to new patients.
How close is the synthetic PET to the real thing?
To judge success, the researchers compared the model’s predicted metabolic activity in fat to the actual PET measurements. They used several statistical tests looking at both individual image points and averages across defined fat regions. Overall, the predictions tracked the real PET values well, with small average errors and reasonably strong correlations in both the neck and upper chest. Agreement held up not only within the dataset used for training but also when the model was tested on the independent lung cancer cohort, despite those scans being more varied in image quality and patient characteristics. An additional analysis, where small patches of the CT image were selectively blurred, showed that disturbing fat‑rich areas hurt the model’s performance most, suggesting it had learned to rely on physiologically meaningful structures rather than irrelevant background.
Limits, caveats, and what still needs work
The method is not perfect, and the authors are careful about its boundaries. Performance dropped somewhat in the more heterogeneous lung cancer group, likely because of differences in scanning protocols and the presence of tumors and inflammation, which also change PET signals. The model does not attempt to separate brown fat activity from other sources of uptake inside fat, and it was trained only on two body regions, so its behavior elsewhere remains unknown. Small mismatches between PET and CT alignment can also mislead the network, especially when strong PET signals from nearby tissues spill into fat on the training images. Finally, commonly used image tricks, such as reshaping the brightness distribution of PET values to make rare hot spots more visible, did not improve and sometimes destabilized training, so the authors kept to standard, physiologically meaningful PET measures.
What this means for patients and future care
Despite these uncertainties, the study shows that routine, non‑contrast CT scans can be transformed into PET‑like maps of metabolic activity in fat, without injecting any radioactive tracer. That capability could open the door to large‑scale studies of how active fat relates to weight control, diabetes, and heart disease, all using scans that many patients already receive for other reasons. While the current tool is geared toward research rather than diagnosis, it points toward a future in which a single structural scan could quietly double as a window into tissue function, helping doctors understand not just how much fat a person carries, but how “alive” that fat is.
Citation: Cano-Espinosa, C., Subrize, M.W., Franquet, E. et al. Quantification of PET activation in adipose tissue from non-contrast CT scans. npj Digit. Med. 9, 209 (2026). https://doi.org/10.1038/s41746-026-02392-0
Keywords: brown adipose tissue, deep learning imaging, PET CT, metabolic health, body composition