Clear Sky Science · en
Annotation-free 3D reconstruction and quantification of retinal microvasculature by RADAR
Seeing Health Through the Back of the Eye
The tiny blood vessels at the back of our eyes do far more than nourish the retina. Because they can be seen non‑invasively, they act as a living map of the body’s small blood vessels, offering early clues about conditions such as diabetes, kidney disease, and heart problems. This study introduces a new computer method, called RADAR, that turns eye scan data into detailed three‑dimensional models of these minute vessels—without relying on labor‑intensive human labeling or fragile artificial‑intelligence training. 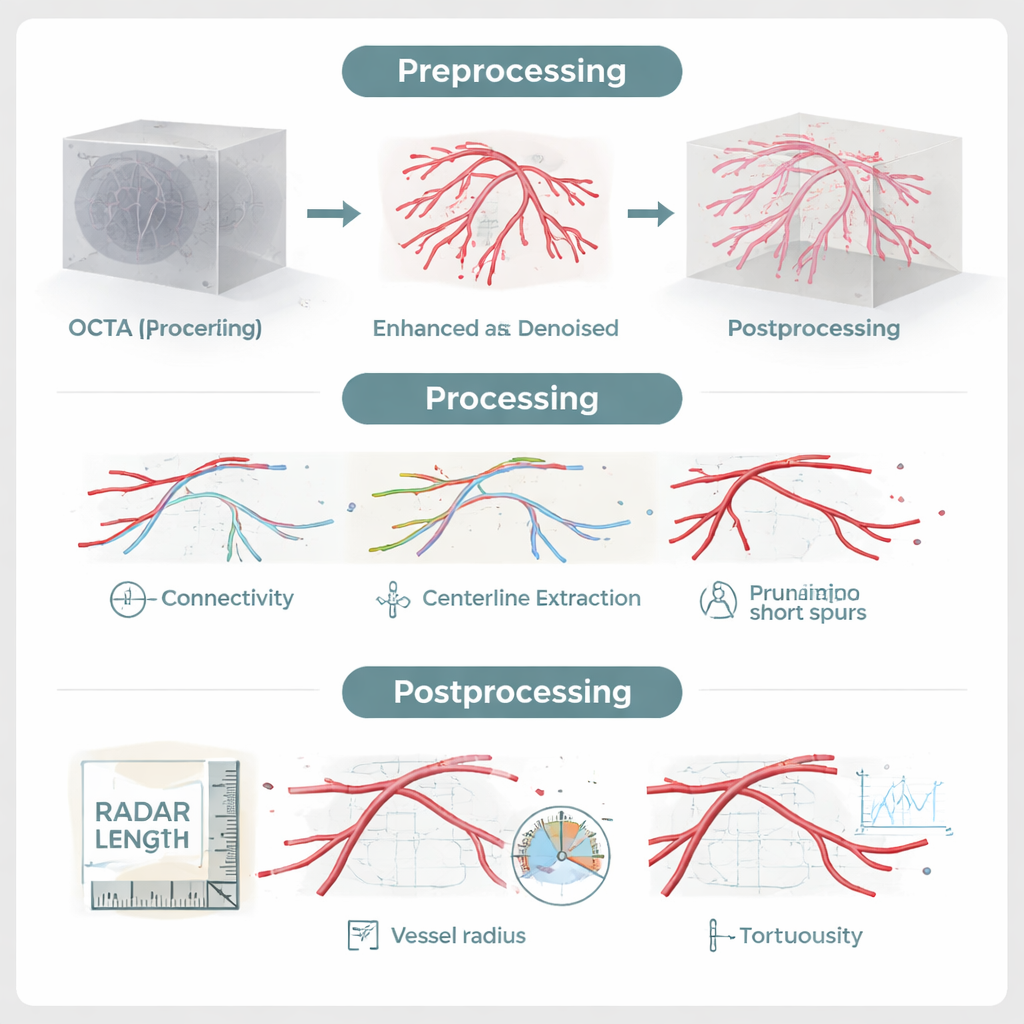
Why Flat Pictures Hide Important Clues
Modern eye scanners known as optical coherence tomography angiography (OCTA) can capture a full 3D volume of blood flow in the retina. Yet, in clinics today, these rich datasets are usually compressed into flat, top‑down images. When all the layers of vessels are squashed onto a single plane, structures lying at different depths overlap, small gaps are masked, and subtle loss of capillaries can disappear from view. That is a serious limitation, because early damage from diabetes and other diseases often begins in the finest capillaries long before obvious signs of retinopathy or vision loss appear.
A Map Built From Physics, Not Guesswork
Most recent attempts to extract the vessel network from OCTA scans have turned to deep learning, where neural networks learn patterns from thousands of pre‑labeled examples. These approaches can work well but come with drawbacks: they demand large, carefully annotated datasets, may fail when the scanner or imaging protocol changes, and often behave like a “black box.” RADAR takes a different route. It is a model‑based pipeline that encodes how vessels should look and behave in three dimensions—continuous, curved tubes that branch and reconnect—rather than trying to learn everything from data. A specialized denoising filter strengthens signals from tubular structures while preserving their twists and turns, and a connectivity step uses probability‑based paths to bridge breaks caused by noise or motion, guided by the local direction of vessels rather than by simple brightness thresholds.
From Tangles of Pixels to Measurable Networks
Once the vessels are enhanced and reconnected, RADAR extracts their central “skeleton,” identifies branch points and endpoints, and prunes tiny spurs that are likely artifacts. What remains is a clean 3D graph of the retinal circulation. From this model, the software can directly measure features that matter clinically: how many vessel segments exist, their total length and surface area, average width, and how winding (tortuous) they are. Crucially, it can do this separately for the superficial, middle, and deep layers of the retina, after aligning the vessel network with the individual’s retinal anatomy. Validation against painstaking manual 3D tracing showed that RADAR’s segmentations are highly accurate, and the entire process—from raw scan to full set of numbers—takes about six minutes per eye. 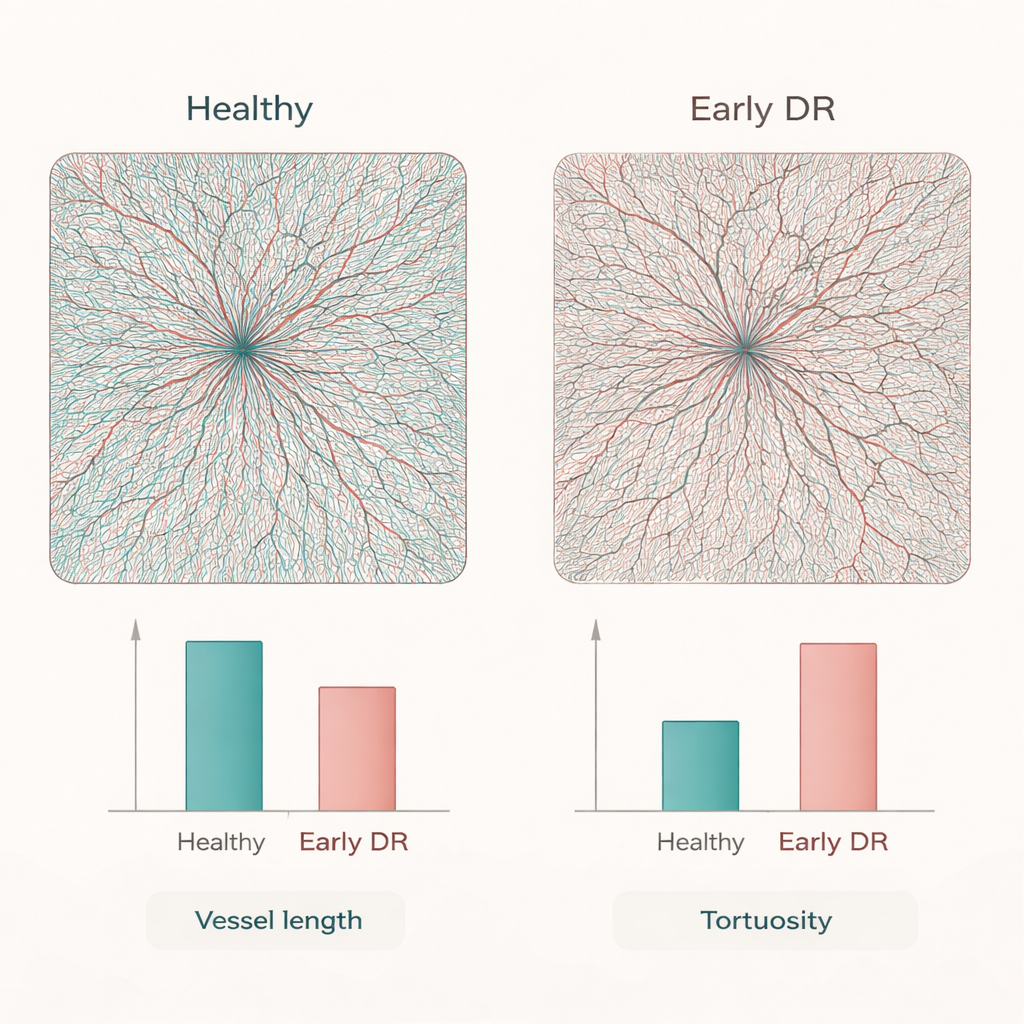
What Changes in Early Diabetic Eye Disease
To test its real‑world value, the researchers applied RADAR to OCTA scans from 50 healthy adults and 50 patients with early diabetic retinopathy. On standard flat images, both groups looked similar. In contrast, the 3D reconstructions revealed that diabetic eyes already had fewer and shorter vessel segments, less total vessel surface area, and more endpoints with fewer branch points—signs of capillary dropout and a simplified network. At the same time, the remaining vessels, especially the smaller ones, were more twisted. By condensing these changes into easy‑to‑interpret metrics, such as the ratio of segments to branch points or tortuosity patterns by vessel size, RADAR uncovered disease‑related remodeling that would likely be missed with current 2D methods.
What This Could Mean for Patients
For non‑specialists, the key message is that this technique turns eye scans into a highly detailed 3D map of the smallest blood vessels, revealing early damage long before vision is affected. Because it does not depend on human labeling or retraining for each new scanner, RADAR could be scaled across clinics to track microvascular health over time, help doctors detect diabetic eye disease earlier, and potentially flag risk for broader cardiovascular problems. In the long run, such 3D “vascular fingerprints” from the eye may become routine markers that guide prevention and treatment well before irreversible harm occurs.
Citation: Zhang, H., Liu, X., Wu, J. et al. Annotation-free 3D reconstruction and quantification of retinal microvasculature by RADAR. npj Digit. Med. 9, 181 (2026). https://doi.org/10.1038/s41746-026-02366-2
Keywords: retinal microvasculature, OCTA, 3D reconstruction, diabetic retinopathy, vascular biomarkers