Clear Sky Science · en
Multi-scalar risk drivers for a heat vulnerability assessment framework using machine learning algorithms
Why rising heat is everyone’s problem
Across the tropics, hotter days and stickier nights are no longer just uncomfortable—they are becoming a quiet public health crisis. This study focuses on Malaysia as a window into how heat, air pollution, and social inequality combine to raise the risk of death, especially for older people and poorer communities. By blending big datasets from satellites and government records with modern machine learning, the researchers show which factors matter most, and offer a practical way for authorities in many tropical countries to find neighborhoods that need help first. 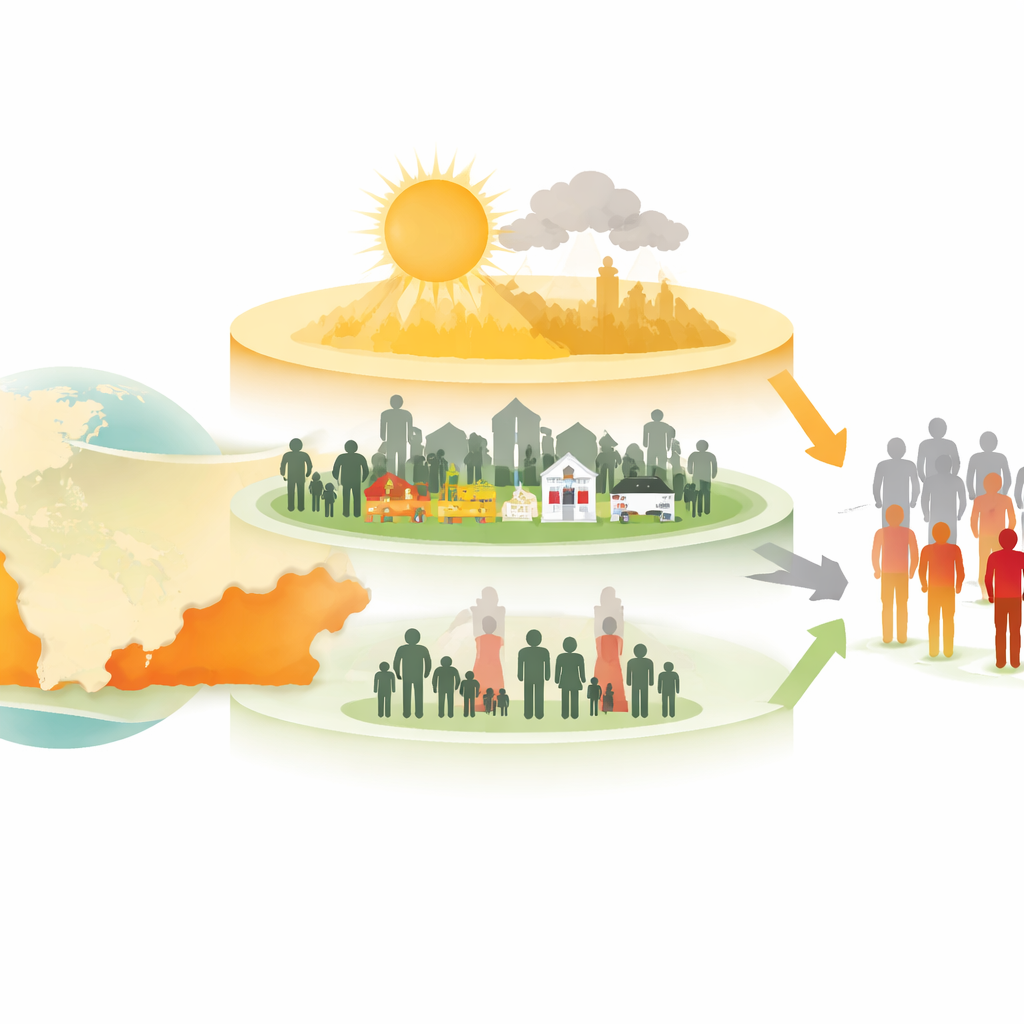
Heat, cities, and people at risk
Many tropical and subtropical regions, including Southeast Asia, are warming faster and experiencing longer hot spells. In crowded cities, concrete and asphalt trap heat, while limited green space and poor housing leave people exposed. Older adults, infants, people with chronic heart or lung disease, and low-income households struggle the most to cope with extreme heat. In Malaysia’s fast-growing urban centers, these vulnerabilities overlap: dense populations, aging residents, and economic hardship stack the odds against many communities when temperatures climb.
Building a score for community vulnerability
To untangle this complex picture, the authors built a Heat Vulnerability Index, or HVI, for all 13 states and three federal territories in Malaysia between 2010 and 2020. Instead of looking at temperature alone, they combined sixteen indicators, including the share of elderly residents, poverty levels, education, access to clean water and healthcare, and the amount of greenery. A statistical method was used to compress these different measures into a single score that reflects how hard it would be for a community to withstand dangerous heat. Ethnic composition and access to basic services emerged as especially influential parts of this index.
Adding the environment: land versus air
The team then asked a key question: when predicting deaths linked to hot conditions, which kind of environmental information works best alongside the HVI? They compared two layers. The first used local land features such as vegetation cover and the difference between daytime and nighttime land surface temperature, which can hint at how well an area cools off after dark. The second layer focused on broader atmospheric conditions: a thermal comfort measure that blends temperature, humidity, wind, and sunlight, plus levels of fine particles in the air and ozone. These data were drawn from satellite and reanalysis products and averaged yearly to match state-level death counts. 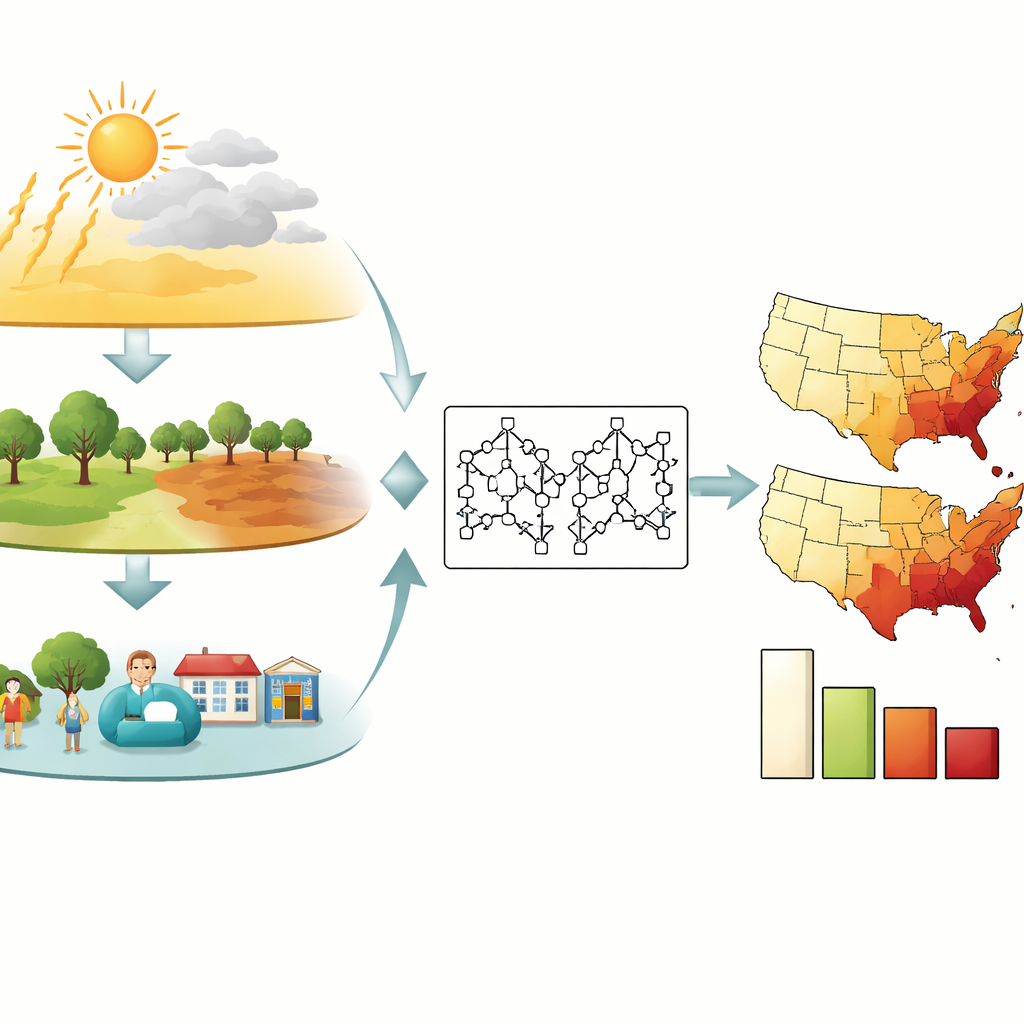
Letting the algorithms decide
Using multiple machine learning models, including a Random Forest approach, the researchers tested how well different combinations of social and environmental variables could explain variations in all-cause mortality from year to year. The most reliable setup combined the HVI with the atmospheric layer—heat stress, fine particles, and ozone—rather than with land-based measures alone. In this winning model, the HVI was by far the strongest predictor, followed by ozone and the thermal comfort measure, with fine particles still playing a meaningful role. Advanced interpretation tools revealed that these influences were not uniform: in eastern Malaysia, for example, dirty air and high vulnerability reinforced each other, while some western regions showed more complex patterns where very high ozone sometimes coincided with lower measured risk, likely reflecting local chemistry and weather effects.
Unequal heat in a warming world
Looking over time, the study found that both heat stress and mortality have risen across Malaysia, and that community vulnerability has also crept upward since 2018. In other words, not only is the climate becoming harsher, but the social safety net that helps people withstand it is fraying. Some states with very high vulnerability do not yet see the highest death counts, suggesting a window of opportunity to act before future heatwaves hit. The analysis also showed that the framework stayed stable across different years, even during disruptions such as the COVID-19 period, although unusual events can temporarily change death patterns.
From numbers to action
For a layperson, the core message is clear: heat is dangerous not just because of temperature, but because of who is exposed and what other stresses they face—especially polluted air and weak access to services. The study shows that pairing a social vulnerability score with broad measures of heat and air quality offers a powerful, transferable way to spot high-risk communities. For big cities, that means tightening air pollution controls and expanding shade and cooling green spaces. For poorer and more remote regions, it means bolstering healthcare, housing, and early warning systems. As tropical countries continue to warm, tools like this framework can help turn abstract climate risks into concrete maps and priorities that save lives.
Citation: Li, Z., Fong, C.S., Aghamohammadi, N. et al. Multi-scalar risk drivers for a heat vulnerability assessment framework using machine learning algorithms. Sci Rep 16, 10594 (2026). https://doi.org/10.1038/s41598-026-44880-z
Keywords: heat vulnerability, tropical climate, air pollution, machine learning, public health risk