Clear Sky Science · en
Properties and inference of the Pareto Lomax distribution with applications to real data
Why flexible risk curves matter
When doctors track how long cancer patients stay in remission, or engineers measure how long materials last before breaking, they rely on statistical curves to summarize risk over time. Many of these curves assume that risk either steadily rises or falls. But real life is messier: danger can spike early, flatten out, or increase again late in life. This paper introduces a new mathematical tool—the odd Pareto–Lomax (OPLx) distribution—designed to capture these complex patterns more faithfully, helping researchers describe extreme events and failure times in medicine, engineering, finance, and other data-rich fields.
A new way to capture long-shot events
At the heart of the study is a classic model called the Lomax distribution, long used to represent heavy-tailed data where rare but very large outcomes—such as huge insurance losses or very long survival times—are more common than simple models predict. The authors build on this foundation by weaving in a broader family of curves known as the odd Pareto–G family. This combination adds two extra “shape” knobs to the original Lomax model, creating the four-parameter OPLx distribution. With these extra degrees of freedom, the new model can represent a wide variety of curve shapes, including steadily decreasing risk, steadily increasing risk, single-peaked “unimodal” patterns, and even J-shaped and reversed J-shaped behaviors often seen in real-world lifetime data. 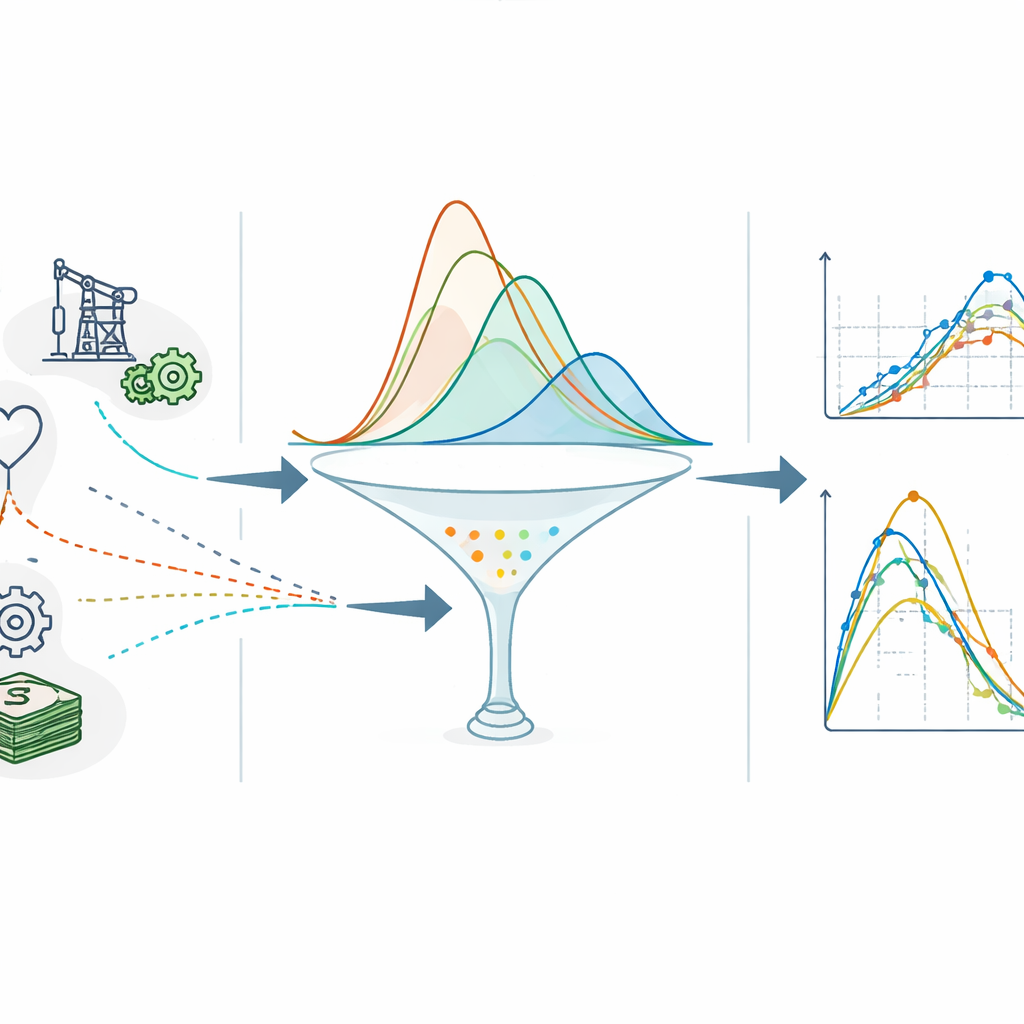
Peeking under the mathematical hood
The paper explores how this new distribution behaves in depth. The authors derive formulas that describe its probability curve, the chance that a lifetime is shorter than a given time, and the hazard rate—the instantaneous risk of failure. They show that the OPLx curve can be written as a mixture of simpler Lomax curves, which lets them recycle many known mathematical results. They compute numerical summaries such as the average lifetime, its variability, and measures of asymmetry and “peakedness.” These calculations reveal that the OPLx distribution is particularly good at representing strongly right-skewed data, where most observations are small but a few very large ones stretch out the tail.
Comparing ways to estimate the curve
To turn theory into practice, one must estimate the four OPLx parameters from real data. The authors systematically compare eight different estimation strategies, ranging from the widely used maximum likelihood method to approaches based on least squares, spacings between data points, and goodness-of-fit measures that give extra weight to the central region or to the tails. Using extensive computer simulations with thousands of synthetic datasets under many parameter settings and sample sizes, they track how far each method’s estimates stray from the true values and how variable they are. The results show that all methods improve as more data are available, but methods that emphasize the right tail—especially the right-tail Anderson–Darling (RADE) approach—tend to be more accurate and stable, particularly when datasets are modest in size. 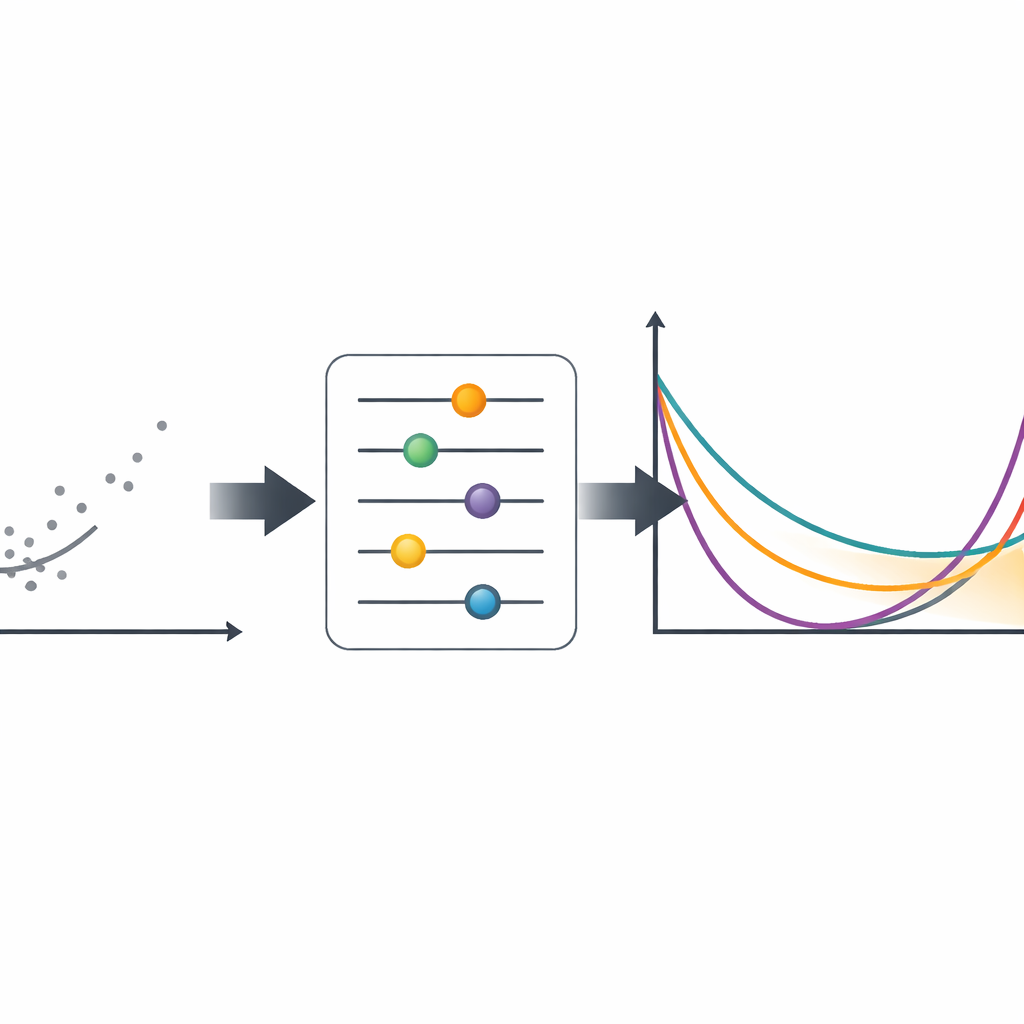
Putting the model to real-world tests
The authors then test the OPLx distribution on three very different datasets: remission times for bladder cancer patients, survival times of guinea pigs infected with tuberculosis, and the fatigue life of a composite material under high stress. For each dataset, they compare OPLx with a suite of competing models, including many refinements of the Lomax distribution as well as standard workhorses like the Weibull and gamma distributions. Using a battery of diagnostic tools—information criteria that penalize overly complex models, distance measures that compare fitted curves to the data, and Kolmogorov–Smirnov tests—the OPLx model consistently comes out on top. It fits both the bulk of the data and the extreme tail behavior better than its rivals, a conclusion reinforced by visual checks such as fitted curves and quantile–quantile plots.
What this means for everyday decisions
In plain terms, this work offers a more flexible and accurate lens for viewing risks that play out over time, especially when rare but impactful events matter. By allowing the risk curve to bend into many shapes and by focusing on the extremes, the odd Pareto–Lomax distribution can improve reliability studies of materials, survival analyses in medicine, assessments of financial losses, and even machine-learning tasks that must pay attention to outliers, such as fraud detection or early fault diagnosis. The authors show that not only does this new curve describe real data better than many existing options, but there are also practical, well-performing methods to estimate it. As such, the OPLx distribution stands as a powerful new addition to the statistical toolkit for understanding how and when things fail.
Citation: Afify, A.Z., Mahran, H.A., Alqawba, M. et al. Properties and inference of the Pareto Lomax distribution with applications to real data. Sci Rep 16, 9082 (2026). https://doi.org/10.1038/s41598-026-43273-6
Keywords: heavy-tailed data, lifetime modeling, risk and reliability, survival analysis, extreme events