Clear Sky Science · en
Spatial hotspot analysis of soil erosion rate and classification of homogeneous zones using GIS in a mountainous contrasting land-use watershed
Why the Land on Hills Matters to Everyone
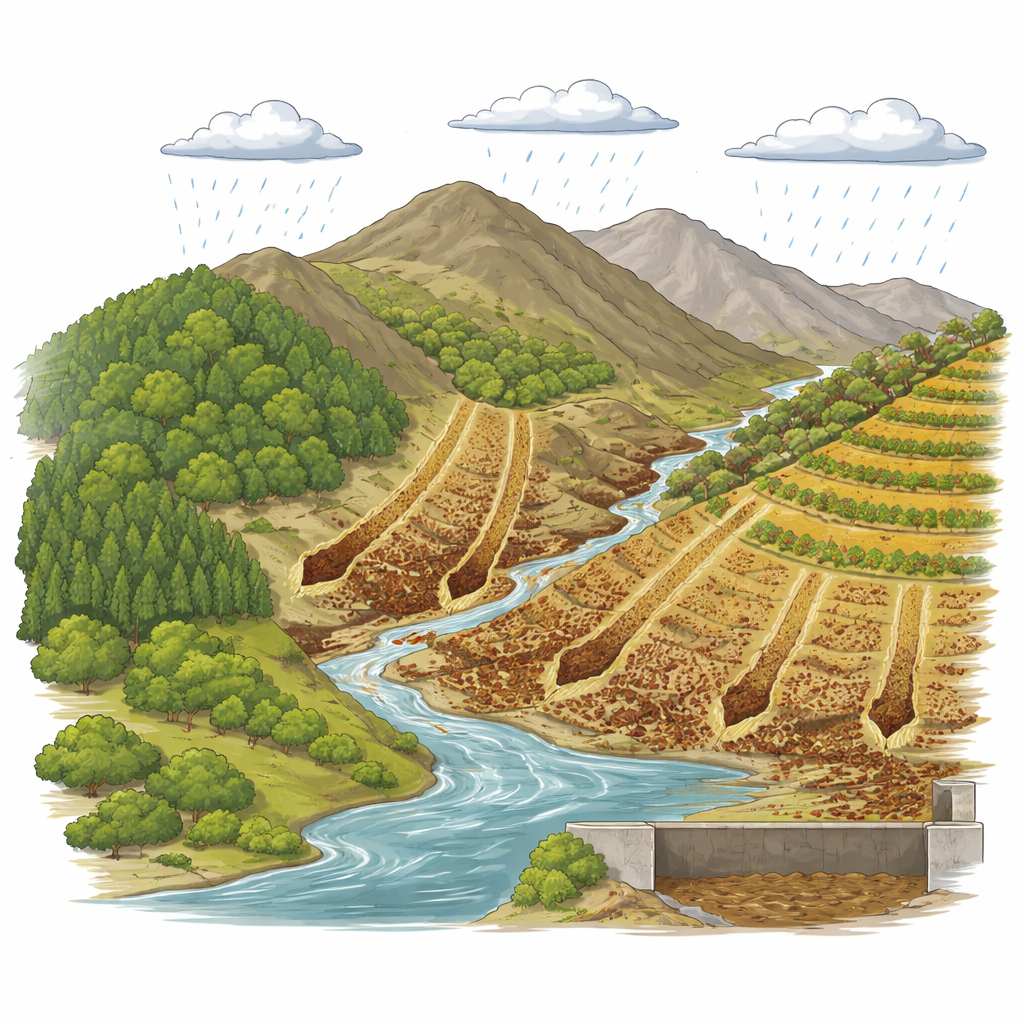
When rain falls on steep hills, it can carry away the thin, fertile layer of soil that farms and natural ecosystems depend on. In many mountain regions, this hidden loss of soil also muddies rivers, fills reservoirs with sediment, and threatens both food production and clean water. This study looks closely at one such region in northwestern Iran and shows how modern mapping tools can pinpoint where soil is being lost fastest, helping communities decide exactly where to act before the damage spreads.
The Mountain Basin Under Pressure
The research focuses on the Qara-Su watershed, a large mountain basin that feeds an important river system and supports farms, forests, towns, and tourist areas. The landscape is rugged, with elevations rising from valley floors to high peaks and average slopes steep enough to speed rainwater downhill. The climate is semi-arid to temperate, meaning that while rainfall is not constant, storms can be intense. Overgrazing, expansion of cropland onto slopes, and thinning of natural vegetation have made many hillsides more fragile, even as data from ground stations to track sediment in rivers remain scarce. Because direct measurements are limited, the authors rely on satellite data, digital elevation models, and geographic information systems to reconstruct how water and soil move across the terrain.
Turning Rain, Soil, and Slopes into a Map
To estimate how much soil is lost and where, the team uses a widely adopted tool called the Revised Universal Soil Loss Equation, or RUSLE. This approach combines five ingredients: how hard rain hits the ground, how easily soil breaks apart, how long and steep slopes are, how much plants protect the surface, and whether people use soil-saving practices like terracing or contour plowing. The researchers gather forty years of rainfall records, create a detailed map of slopes from a high-resolution elevation model, and classify land use from recent satellite images, including a vegetation index that shows where plants are dense or sparse. By feeding these layers into the model, they generate a map of yearly soil loss across the entire watershed. Their results show average erosion of about seven tons of soil per hectare each year, with more than two-thirds of the area falling into moderate to very high risk classes. The worst losses occur on long, steep slopes with fine, easily eroded soils and poor plant cover, especially where cropland climbs up the hills.
Finding Hotspots and Safe Zones
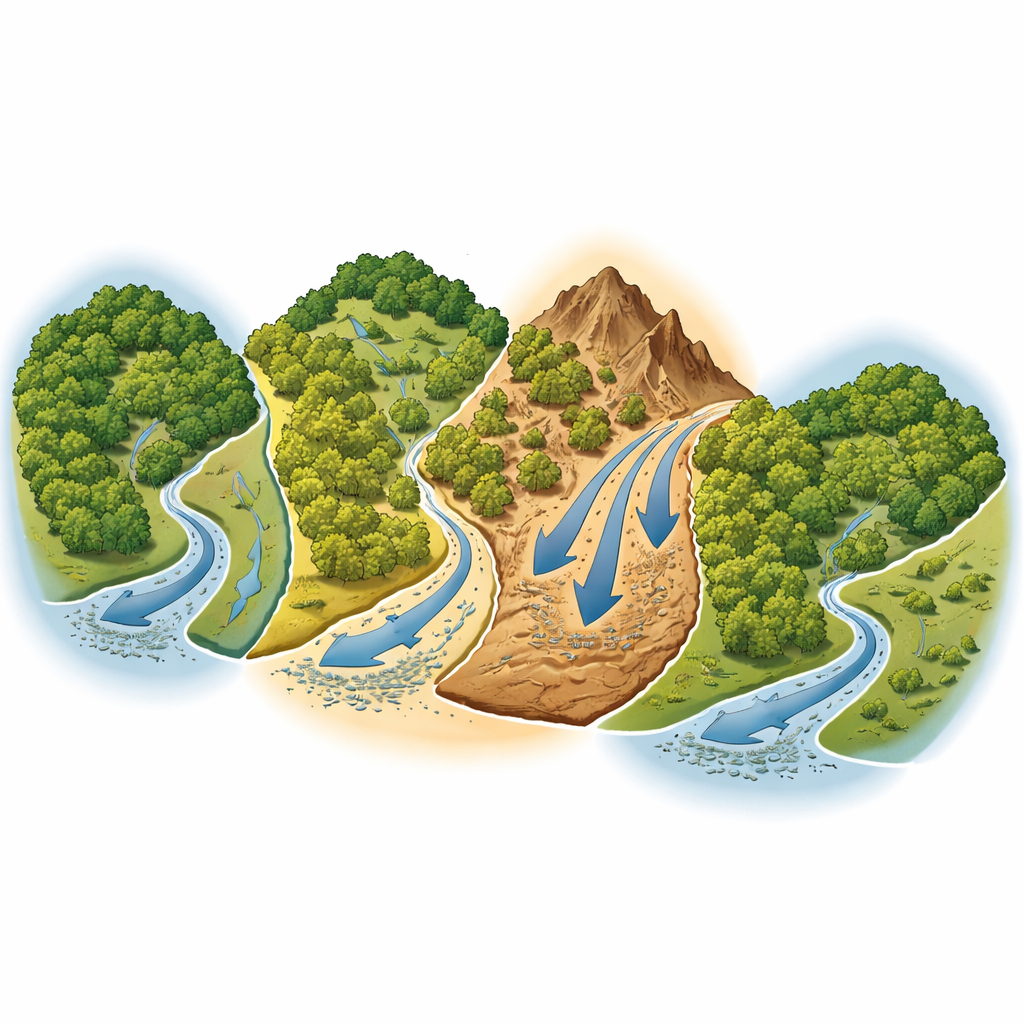
The study goes beyond simply mapping average erosion by asking whether high-loss areas tend to cluster together. Using spatial statistics, the authors test whether neighboring sub-watersheds share similar erosion levels more often than random chance would allow. They find that erosion is strongly clustered: groups of sub-watersheds in the southwest behave as “hotspots,” where many adjacent areas all show high soil loss, while the north and northeast form “coldspots,” with consistently low erosion and relatively stable conditions. The southwest hotspots stand out because they combine very steep, lengthy slopes with more intense rain and weaker vegetation, whereas the stable zones have gentler terrain, less erosive storms, and better plant cover or management. This pattern reveals that it is not any single factor but the combination of terrain, climate, soil, and land use that pushes parts of the watershed over a threshold into serious degradation.
Guiding Action on the Ground
By ranking each sub-watershed according to both its erosion rate and its statistical importance as a hotspot or coldspot, the researchers build a clear priority list for action. Sub-watersheds in the southwest with the strongest hotspot signals are flagged for immediate, intensive measures such as terracing, runoff control structures, and restoration of plant cover. Areas with moderate risk but located next to hotspots are marked for careful monitoring, since they could worsen if land use changes or storms intensify. Meanwhile, the low-erosion coldspots are treated as reference and protection zones, where maintaining current good practices is crucial. This tiered approach allows scarce resources to be directed where they will have the greatest impact on reducing sediment and protecting water supplies.
What the Study Means for Land and Water
In everyday terms, the study shows that we can now see, almost hill by hill, where the land is washing away and why. In the Qara-Su watershed, the most dangerous places are steep, heavily farmed slopes exposed to strong storms and lacking the cushion of vegetation or conservation measures. By combining erosion modeling with spatial clustering tools, the authors offer a blueprint for focusing soil-saving efforts on the true trouble spots instead of spreading them thinly everywhere. Their approach can be repeated in other mountain regions, helping communities protect fertile soil, keep reservoirs from filling with mud, and build more resilient landscapes in the face of ongoing land-use change and a shifting climate.
Citation: Saeedi Nazarlu, F., Khavarian Nehzak, H., Mostafazadeh, R. et al. Spatial hotspot analysis of soil erosion rate and classification of homogeneous zones using GIS in a mountainous contrasting land-use watershed. Sci Rep 16, 10456 (2026). https://doi.org/10.1038/s41598-026-41668-z
Keywords: soil erosion, watershed management, remote sensing, mountain landscapes, land use change