Clear Sky Science · en
Innovative generating-information function for consecutive lifetime systems in health research
Why this matters for real-world systems
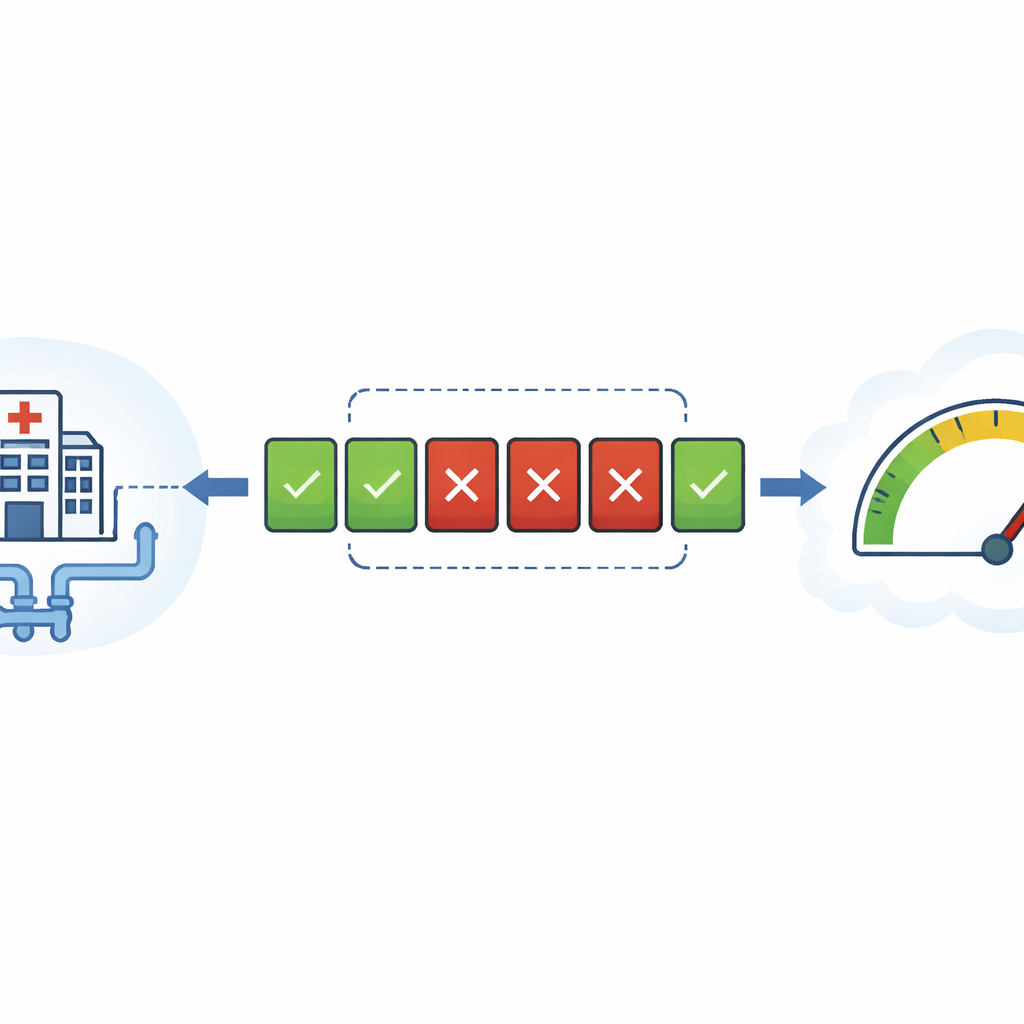
Modern society relies on systems that must keep working even when some parts fail: hospital monitoring lines, oil pipelines, data cables, or power links. Engineers design many of these as “consecutive systems,” where the whole network is considered failed once a run of neighboring parts goes down. This article develops new mathematical tools to measure how uncertain or fragile such systems are, and shows how those tools can be turned into practical statistical tests, including a real example involving malignant tumor data from Saudi hospitals.
How uncertainty is measured with information
At the heart of the work is the idea of entropy, a concept from information theory that quantifies uncertainty. Classic Shannon entropy measures how unpredictable a single quantity is. Building on this, researchers introduced generating-information functions, which form a flexible family of measures controlled by a tuning parameter. For certain parameter choices, this family recovers well-known quantities: the negative of Shannon entropy, and a related energy-like measure called extropy. The paper studies how this rich family behaves not just for single components, but for entire engineered systems whose lifetimes depend on many parts acting together.
From single parts to linked chains of components
Many practical designs can be described as “consecutive l-out-of-m” systems: imagine a line of m identical components that keeps working as long as you never see l failed components in a row. This structure covers classic extremes such as fully series and fully parallel systems, and it appears in technologies as varied as vacuum systems, oil pipelines, microwave relays, and parking controls. The paper derives new formulas that express the information content of the overall system lifetime directly in terms of the behavior of its parts. A key insight is that, by cleverly transforming component lifetimes into equivalent data that behave like samples from a simple uniform distribution, the complex system-level measure can be written as a more manageable integral over the unit interval.
Comparing designs and bounding risk
Exact formulas for system-level information measures can quickly become intractable when there are many components or when their lifetimes follow complicated distributions. To cope with this, the author develops sharp upper and lower bounds that “sandwich” the true value. These bounds depend on simple summaries of the component behavior, such as where the density is highest (its mode) or how spread out the lifetimes are. The paper also develops rules for stochastic comparison: under broad conditions, if one component design is more variable or more failure-prone than another, then the corresponding consecutive system will have a larger information measure, signaling greater overall uncertainty. These results allow engineers and statisticians to compare alternative designs without resolving every mathematical detail.
Peering inside the mechanism and characterizing distributions
The information measure for a consecutive system turns out to be powerful enough to “characterize” the underlying lifetime distribution. In simple terms, if two different component models yield identical information behavior for every allowable consecutive-system configuration, then they must in fact be versions of the same distribution, differing only by a shift or scale. The paper proves several such characterization theorems, including a striking one for the uniform distribution: the way information accumulates in certain consecutive systems uniquely identifies whether the data are truly uniform or not. This lays the theoretical foundation for new goodness-of-fit tests.
Turning theory into estimators and tests
To make these ideas usable on real data, the author introduces two non-parametric estimators for the system-level information measure. These estimators work directly with ordered sample values, using differences between neighboring data points within a sliding window to approximate the underlying distribution. Extensive computer experiments show that both estimators become more accurate with larger sample sizes, but the second—slightly more refined—version has smaller bias and error overall. Building on this, the paper proposes a new test for checking whether data are uniform, a question that arises frequently in simulation, quality control, and social science modeling. When compared against classic tests like Kolmogorov–Smirnov, Anderson–Darling, and Cramér–von Mises, the new test shows competitive or superior power under many alternatives, especially when the true distribution is more spread out than uniform.
Real health data and practical impact
The methodology is applied to malignant tumor data from Saudi Arabia, where the exponential model is first verified as a reasonable fit. Using the proposed estimators, the author evaluates the information structure of hypothetical consecutive systems built on that model, and then applies the new uniformity test to transformed tumor data from a different region and patient group. The results support the theoretical claims: the refined estimator is more stable, and the test behaves as predicted. For a lay reader, the main message is that we now have a more nuanced “information-based” lens for judging how robust linked-component systems are, and a practical way to use that lens in data analysis. These tools can guide better design and more reliable statistical decisions in fields ranging from engineering infrastructure to health research.
Citation: Mohamed, M.S. Innovative generating-information function for consecutive lifetime systems in health research. Sci Rep 16, 9097 (2026). https://doi.org/10.1038/s41598-026-41369-7
Keywords: system reliability, information theory, entropy, uniformity testing, health data analytics