Clear Sky Science · en
Quantitative Kernel estimation from traffic signs using slanted edge spatial frequency response as a sharpness metric
Why blurry car cameras matter
Modern cars increasingly rely on cameras to spot pedestrians, read traffic signs, and keep vehicles in their lane. But like human eyesight, camera vision can slowly get worse with age, heat, vibration, or small assembly shifts. This article explores a new way to “measure” how blurred an automotive camera has become by looking at everyday traffic signs, potentially allowing car makers to monitor camera health over time instead of waiting for failures.
Turning traffic signs into test charts
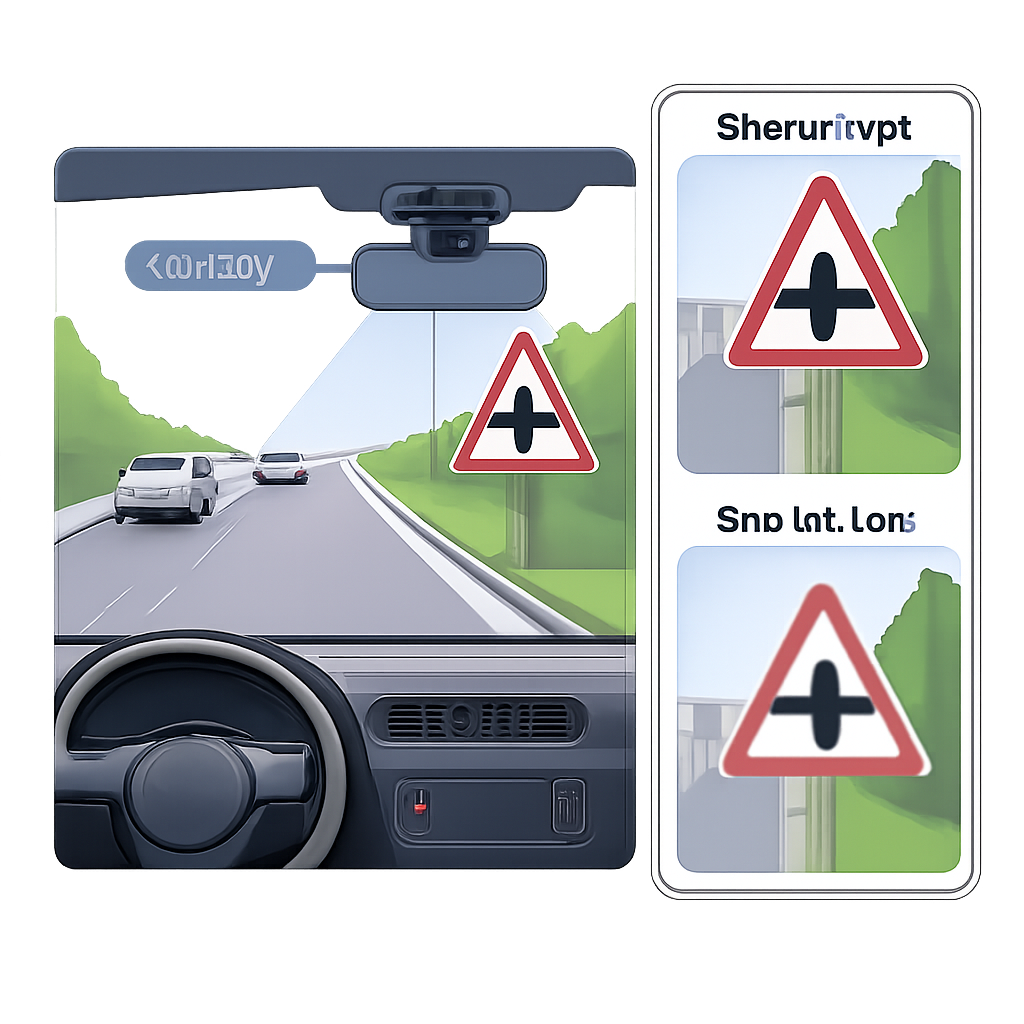
In factories, camera sharpness is checked on special test patterns before a unit ships. On the road, however, there is no such controlled target—only the real world. The authors exploit one common, repeatable object in that world: traffic signs with clean, high-contrast edges. They focus on a standard sharpness measure called spatial frequency response (SFR), which essentially tells you how well a camera preserves fine detail in an image. By analyzing slightly tilted (“slanted”) edges on traffic signs, they can compute SFR in a similar way to lab tests, but directly from real driving scenes.
Capturing how a lens spreads light
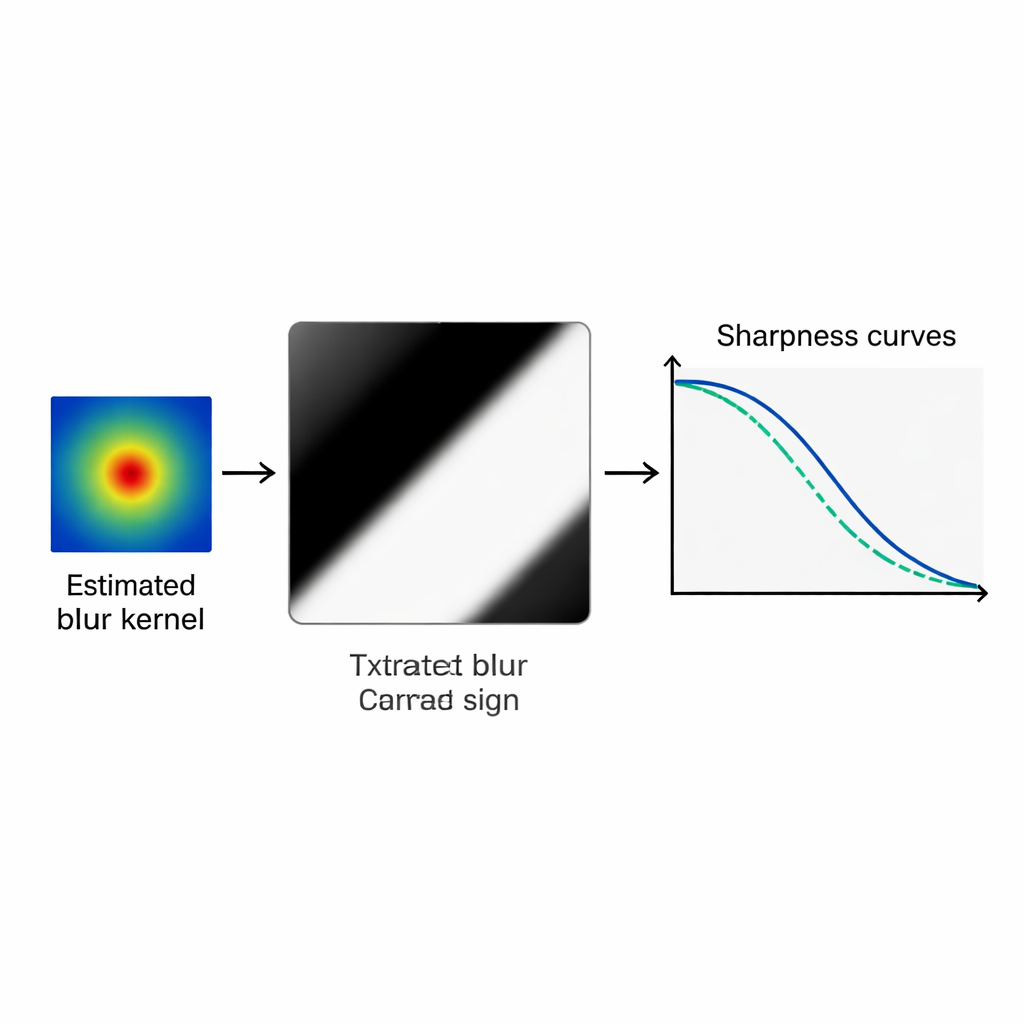
Blurring in a camera can be described by a tiny image called a blur kernel, or point spread function. It shows how light from a single point in the scene is spread out over neighboring pixels on the sensor. Estimating this kernel directly from a blurred photograph is normally very hard, because many possible combinations of sharp image and blur pattern can produce a similar result. To tackle this, the researchers first use optical design software to simulate about 1300 realistic blur kernels for a specific automotive camera across different focus settings and positions in the image. They then compress this large collection into a compact set of key patterns using a statistical tool called principal component analysis (PCA), so that any realistic blur can be described by only a few dozen numbers instead of hundreds of pixel values.
Matching sharpness curves instead of pixels
Once the compact blur “dictionary” is built, the actual estimation process starts with two small patches, each 45 × 45 pixels, cut from a blurred traffic sign image, together with matching patches from a sharp reference picture of the same sign. For a candidate blur kernel drawn from the PCA model, the sharp patches are artificially blurred and their SFR curves are calculated. These curves are then compared with the SFR curves measured from the real blurred patches. A global optimization method known as differential evolution adjusts the kernel parameters to minimize the difference between the two sets of curves. In effect, the algorithm hunts for the blur pattern that makes the synthetic sharpness curves line up as closely as possible with those measured from the real camera image.
How well does the method work?
The authors first test their method on synthetic data, where they know the true blur kernels exactly. Across ten different blur levels, from very sharp to noticeably defocused, the estimated kernels match the ground truth closely by several independent similarity measures, with structural similarity values typically above 0.95 and very low average errors. They also compare their approach to recent state-of-the-art “blind deblurring” techniques from computer vision, which are designed mainly to make images look better rather than to recover the exact blur shape. On the task of accurately reconstructing the underlying kernel for this specific camera, the new PCA-based method clearly outperforms these baselines. Finally, they apply the algorithm to real images from a modified automotive camera whose sensor can be shifted in tiny steps to induce known defocus. Although the true blur kernels are not available here, the estimated kernels produce synthetic edges whose sharpness curves and visual appearance remain very close to the actual blurred edges over a wide range of focus settings.
From lab technique to camera health check
For non-specialists, the main outcome is that the authors can now turn ordinary traffic signs into a diagnostic tool that reveals how a car camera’s optics are changing over time, and not just whether an image looks sharp or soft. Instead of a single pass/fail number, the estimated blur kernel encodes detailed information about how light is spreading inside the lens, which in turn can be linked back to defocus or specific optical imperfections. While the current method is computationally heavy and works only on small patches around clear edges, it points toward future systems in which occasional images are sent from vehicles to a server that tracks slow degradation of camera sharpness. This could inform preventive maintenance, support safer advanced driver-assistance systems, and ultimately help ensure that the digital “eyes” of autonomous vehicles stay in good health for years of service.
Citation: Pandey, A., Akhtar, M.Z., Veettil, N.K. et al. Quantitative Kernel estimation from traffic signs using slanted edge spatial frequency response as a sharpness metric. Sci Rep 16, 7387 (2026). https://doi.org/10.1038/s41598-026-40556-w
Keywords: automotive cameras, image sharpness, blur kernel, traffic sign imaging, camera health monitoring