Clear Sky Science · en
Machine learning analysis of s-EASIX for predicting 30-day mortality in sepsis patients from MIMIC-IV
Why this matters for patients with severe infections
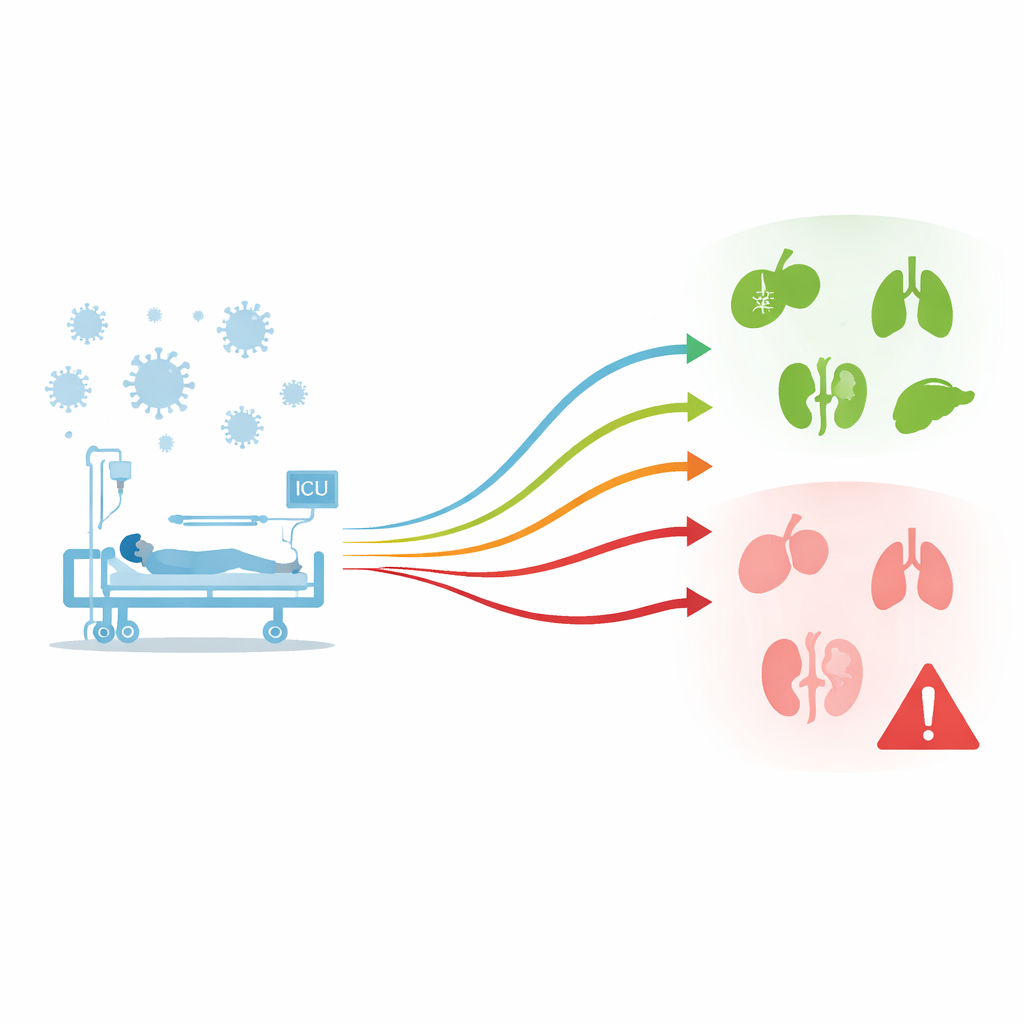
Sepsis, a life-threatening reaction to infection, kills millions of people worldwide each year, often within days of entering an intensive care unit (ICU). Doctors urgently need better ways to spot which patients are quietly heading toward organ failure, even when standard lab tests look only mildly abnormal. This study introduces a simple blood-based index, tracked over time rather than at a single moment, and shows that its changing pattern can forecast who is most at risk of dying within 30 days. By combining modern data science with routine lab results, the work points toward earlier, more personalized treatment for sepsis.
A simple score from everyday blood tests
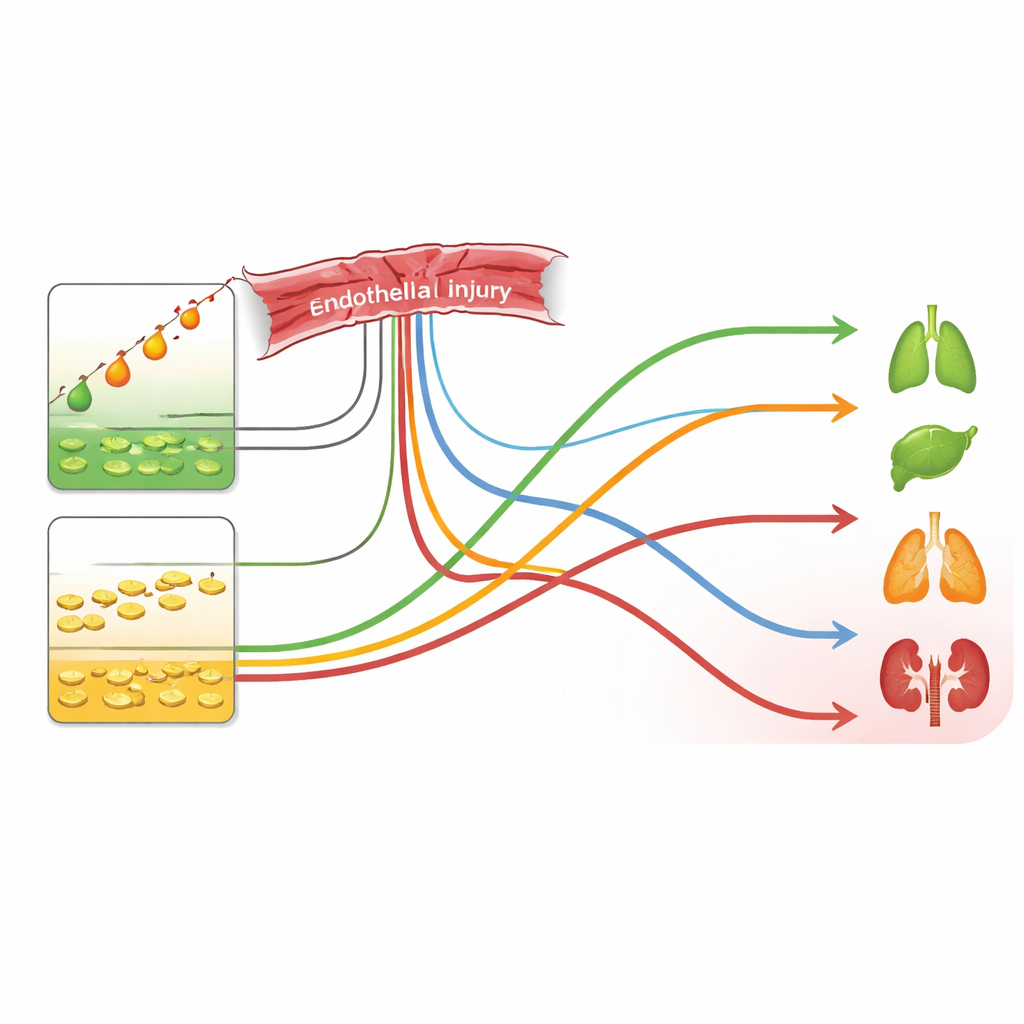
The research centers on a measure called the simplified endothelial activation and stress index, or s-EASIX. It is calculated using just two routine blood test results: lactate dehydrogenase (LDH), a signal of cell damage and metabolic stress, and platelets, the tiny cell fragments that help blood clot. Together, these numbers reflect how badly the inner lining of blood vessels—the endothelium—is being injured during sepsis. When this lining fails, blood flow through the body’s smallest vessels breaks down, organs swell or bleed, and the risk of death rises sharply. Unlike many experimental molecules that require expensive laboratory methods, s-EASIX can be computed from tests hospitals already run for almost every ICU patient.
Following the score’s ups and downs over time
Instead of asking what s-EASIX is on the day of ICU admission, the authors examined how it changes over the first month of illness. Using the large public MIMIC-IV database of intensive care records, they identified 8,113 adults with sepsis who had at least three measurements of LDH and platelets. With a statistical technique that groups patients by similar patterns over time, they uncovered five distinct “trajectories” of s-EASIX: a low-stable group, a medium-stable group, a high but rapidly falling group, a medium but steadily rising group, and a very high group that declined only slowly. These patterns captured the ongoing tug-of-war between infection, inflammation, blood vessel injury, and the body’s ability to recover.
Which patterns spell danger
When the researchers linked these five patterns to survival, the differences were striking. Patients whose s-EASIX started high but dropped quickly over the following days ended up with 30-day death rates similar to those whose scores stayed low or moderate throughout. In contrast, two trajectories proved especially ominous: a mid-level score that kept climbing, and a very high score that ebbed only slightly. After accounting for age, illness severity, organ support treatments, and many other factors, these two groups had roughly two- to three-fold higher risk of dying within 30 days than the low-stable group. The relationship held across men and women, across patients with and without mechanical ventilation, and regardless of whether they received blood-thinning drugs. Younger adults with these “bad” trajectories were at particularly elevated risk, suggesting that a powerful but misdirected immune response may be overwhelming their blood vessels.
Teaching machines to see risky patterns
To test whether computers could use s-EASIX trajectories to improve prediction further, the team built several machine learning models that combined trajectory class with other clinical data. They trained and evaluated six different approaches and found that a method called LightGBM performed best. In the validation group of patients, this model distinguished survivors from non-survivors with high accuracy and reliable calibration, meaning its estimated probabilities closely matched what actually happened. A separate technique, SHAP analysis, was then used to open this “black box” and reveal which inputs drove the model’s decisions. The s-EASIX trajectory emerged as one of the single most influential features, alongside age and an overall organ failure score, underscoring its central role in gauging sepsis risk.
What this means for care at the bedside
For non-specialists, the message is that how a simple blood-based stress score moves over time tells a more powerful story than any one reading alone. A persistently high or steadily rising s-EASIX suggests blood vessels are under continued attack, microcirculation is failing, and organs are edging toward collapse—well before this is obvious from routine vital signs. In principle, tracking this trajectory could help ICU teams identify high-risk patients earlier, tailor the intensity of monitoring and therapy, and perhaps adjust treatments that affect clotting and vessel health. While the study is retrospective and based on data from a single hospital system, and still needs external validation, it highlights a promising, easily accessible tool for turning raw lab numbers into an early warning system for sepsis.
Citation: Kong, Z., Liu, Y., Chen, H. et al. Machine learning analysis of s-EASIX for predicting 30-day mortality in sepsis patients from MIMIC-IV. Sci Rep 16, 8842 (2026). https://doi.org/10.1038/s41598-026-40400-1
Keywords: sepsis, endothelial dysfunction, risk prediction, machine learning, critical care