Clear Sky Science · en
An automated image analysis pipeline for wide-field optical redox imaging of patient-derived cancer organoids
Why this cancer imaging study matters
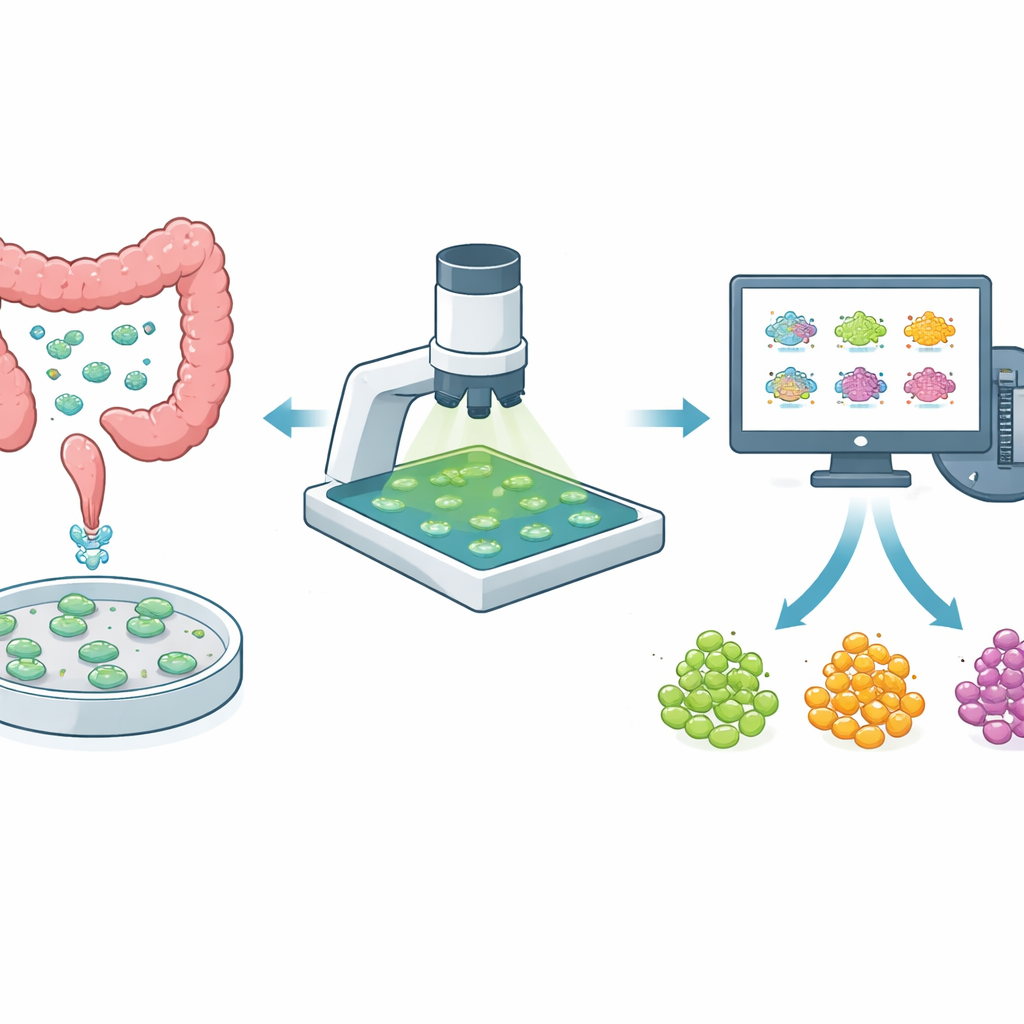
Finding the right drug for each person’s cancer is still a slow, hit‑or‑miss process. This study tackles that problem by combining tiny lab‑grown tumors from patients—called organoids—with a fast, camera‑based way to watch how their energy use changes when drugs are added. The authors show how a new automated computer pipeline can sift through large stacks of microscope pictures, track hundreds of organoids over several days, and reveal which treatments are working, all far faster and more reliably than a human could manage by hand.
Mini-tumors in a dish as test beds
Instead of relying only on cancer cells grown in flat layers, researchers now often use three‑dimensional organoids made directly from a patient’s tumor. These mini‑tumors better preserve the mix of cell types and hidden pockets of drug‑resistant cells that exist in the body. In colorectal cancer, where tumors vary widely from person to person and even within the same patient, organoids are a powerful way to test how well new and existing drugs work. But to be useful for guiding treatment, organoid tests must be both gentle—so the same organoid can be watched over time—and fast enough to screen many drugs and doses.
Watching tumor “fuel use” with light
The team uses a technique called optical redox imaging, which relies on the faint natural glow of molecules inside cells that are involved in energy production. By shining specific colors of light and collecting the emitted glow, a simple wide‑field microscope can capture a map of how “oxidized” or “reduced” each organoid is—a snapshot of its metabolic state. Unlike more complex high‑end microscopes, this setup uses standard components that many labs already own, making it relatively easy to adopt. Changes in this redox signal often appear earlier than changes in organoid size or cell death, turning it into an early warning sign of whether a drug is helping or failing.
Turning raw images into reliable numbers
Until now, analyzing these images meant a person had to draw outlines around each organoid, choose background regions by eye, and then try to track which organoid was which across several days. That slow, error‑prone approach is not suitable for large drug screens. The authors created an end‑to‑end automated pipeline that does three hard jobs: precisely separating each organoid from its surroundings, assigning each one a consistent identity across multiple days, and estimating the background signal in a way that avoids human bias. They fine‑tuned an existing artificial‑intelligence tool (Cellpose) to recognize organoids even when they vary in shape, size, and focus, and then built a tracking algorithm that lines up images taken on different days and matches organoids based on how their shapes and positions overlap.
Zooming in on the most active rim
Organoids have distinct zones: a dead or dying core, a quiet middle region, and a lively outer rim where cells are actively growing and often most sensitive to treatment. The pipeline automatically carves out this thin outer ring—called the leading edge—for each organoid and calculates its redox value. By following the same organoid’s leading edge over three days of treatment with different doses of the drug romidepsin, the software can detect subtle shifts in metabolism. The authors show that this organoid‑by‑organoid tracking reduces variability compared with lumping all organoids together, boosting the statistical power to see drug effects even when responses differ from one mini‑tumor to another.
Faster, more robust insights for drug response
The researchers put their pipeline to the test on images from two different microscope systems and found that the automated outlines closely matched expert‑drawn ones, and the tracking agreed with manual tracking over 94 percent of the time. When they compared overall drug‑response measures, the automated method matched the sensitivity of the manual approach while cutting analysis time by more than a hundred‑fold—from many hours of human effort to just a few minutes of computer processing. For labs working with patient‑derived organoids, this means they can realistically analyze large image collections and uncover how each mini‑tumor reacts to treatment. In the long run, such automated analysis could help bring organoid‑based drug testing closer to the clinic, supporting more personalized and effective cancer care.
Citation: Hsu, A., Samimi, K., Gillette, A.A. et al. An automated image analysis pipeline for wide-field optical redox imaging of patient-derived cancer organoids. Sci Rep 16, 9757 (2026). https://doi.org/10.1038/s41598-026-40249-4
Keywords: colorectal cancer, patient-derived organoids, optical redox imaging, automated image analysis, drug response