Clear Sky Science · en
P.A.D.D.L.E.: a hypothesis generation tool for assessing pollution’s potential role in disease
Why everyday pollution and disease are linked
Most of us know that dirty air and water are bad for our health, but it is surprisingly hard to pin down which specific pollutants may be tied to which diseases. In recent decades, industrial societies have seen a surge in asthma, allergies, autoimmune conditions, and mental health problems at the same time that tens of thousands of largely untested chemicals have entered the environment. The paper behind this summary introduces a new tool, called P.A.D.D.L.E., designed to help scientists connect the dots between pollution levels in different communities and patterns of disease in real patients.
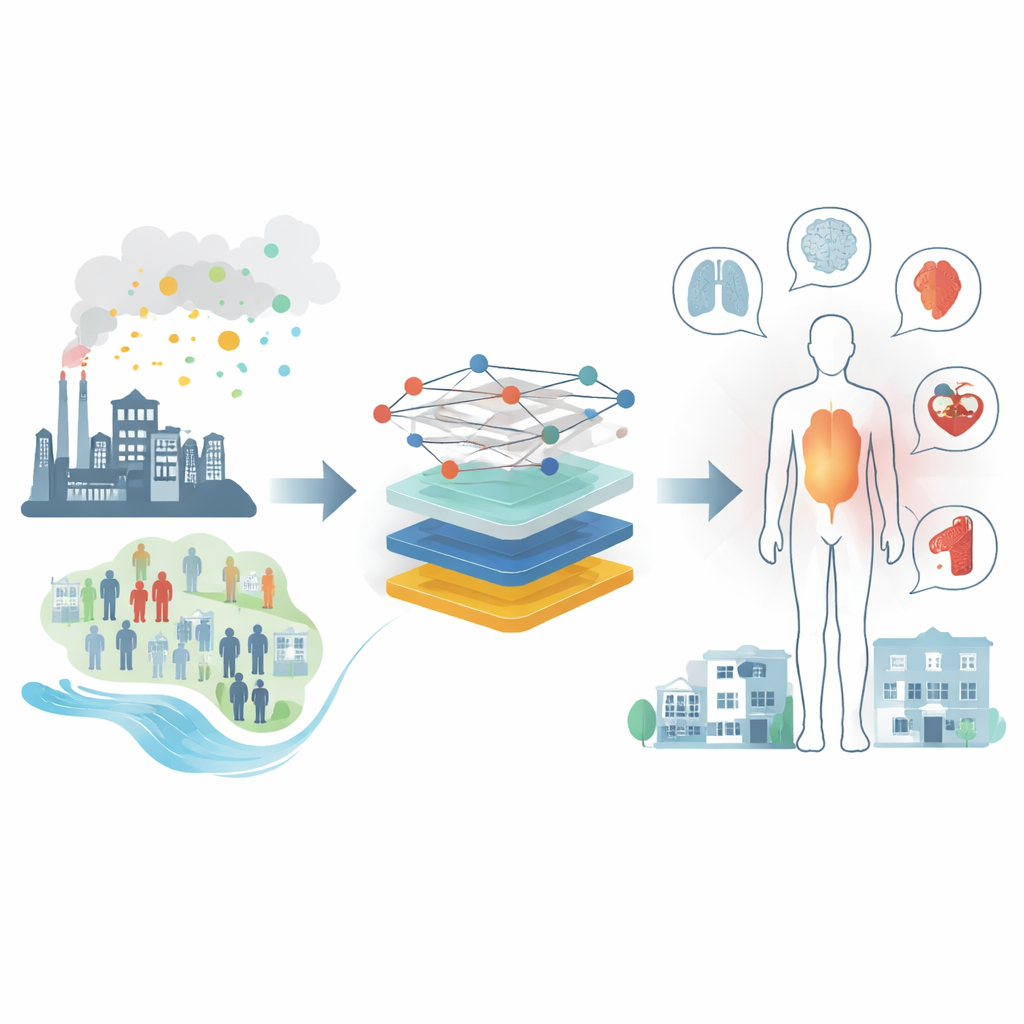
Linking chemical clouds to doctors' offices
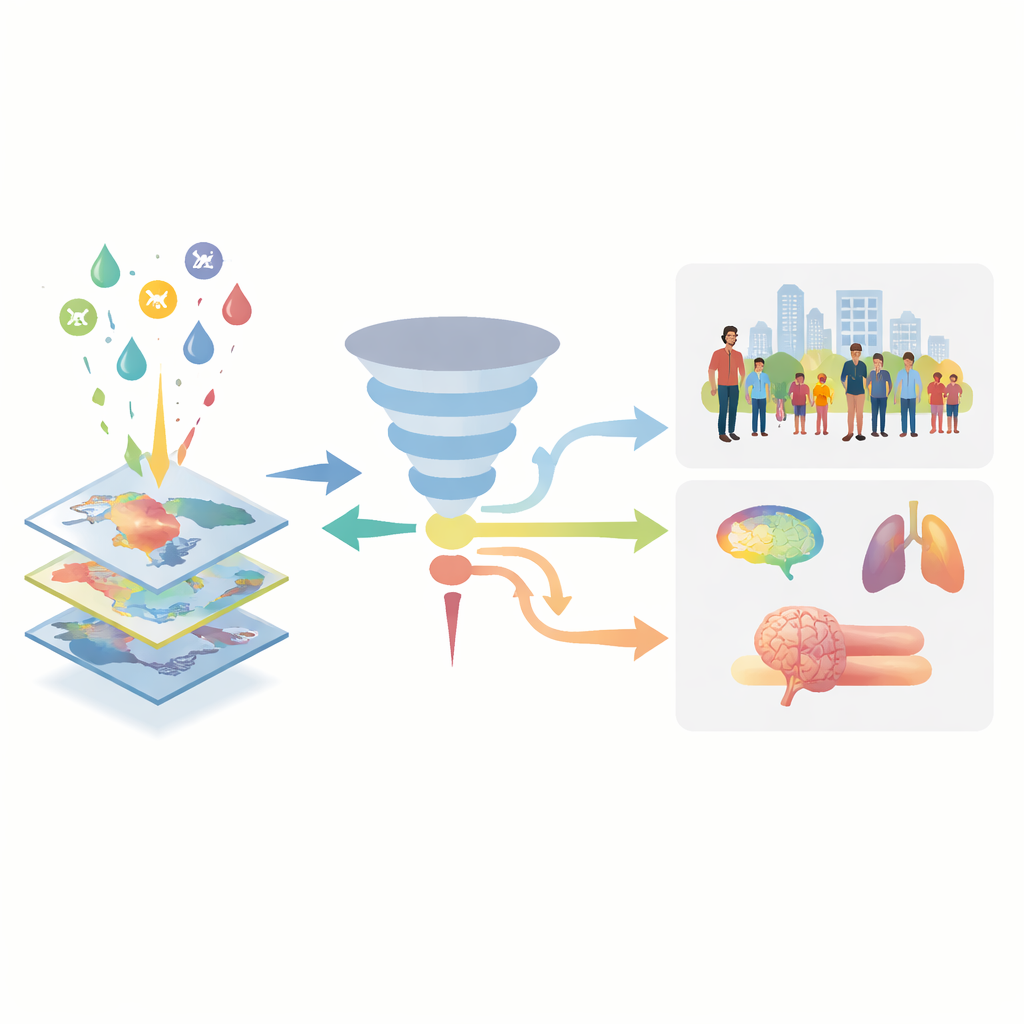
The researchers started by assembling two kinds of nationwide information for the United States. First, they used a massive database of 61.9 million health care visits from 2016, covering nearly six thousand different diagnoses and more than sixteen thousand ZIP codes. Second, they gathered records of 571 air pollutants and 42 water pollutants released by factories or measured in outdoor air and drinking water between 2010 and 2016. They then estimated how much of each pollutant communities around every ZIP code were likely exposed to, while also taking into account factors such as age distribution, population density, poverty level, and overall access to medical care.
How patterns are teased out of noisy data
Because many pollutants travel together—for example, several chemicals are produced by the same traffic or industrial sources—it is easy to be misled by simple one-to-one comparisons. To deal with this, the team used two complementary styles of statistical modeling. One, called penalized regression, looked at many pollutants at once for each disease to see which ones stood out as especially strong predictors after considering their overlap. The other, a spatial model, examined one pollutant at a time but carefully corrected for broad regional differences that might be caused by factors other than pollution, such as local medical habits or geography. Together, these approaches allowed P.A.D.D.L.E. to highlight unusually strong pollution–disease links while still flagging the many uncertainties.
What diseases and communities stood out
Across age groups, the clearest associations appeared in two broad categories: neurodevelopmental conditions, such as attention-deficit hyperactivity disorder, and diseases involving irritation or inflammation of body surfaces, like skin and airways. In children, certain industrial chemicals in drinking water and phosphorus in air emissions correlated strongly with diagnoses of attention and behavioral problems. In adults, pollutants were often tied to mental and behavioral disorders, but also to cancers and reproductive issues, in ways that lined up with earlier, more focused studies. For inherited conditions like sickle cell disease and cystic fibrosis—where pollution cannot cause the disease itself—some air pollutants still tracked with higher visit rates, suggesting they might worsen symptoms or trigger flare-ups that send people to the hospital more often.
Unequal pollution burdens and health risks
The tool also revealed how pollution exposure is unevenly spread across the country. Communities with higher poverty, measured by a deprivation index, tended to have greater exposure to several industrial chemicals, including certain pesticides and flame retardants. The models captured well-known environmental injustices: Black communities were more likely to live in areas with higher levels of common air pollutants like nitrogen dioxide and fine particles, while many Hispanic communities had elevated levels of heavy metals in drinking water. Historically redlined neighborhoods—areas once denied loans because of who lived there—were linked to greater exposure to specific chemicals in both air and water. P.A.D.D.L.E. does not claim that race or poverty inherently cause disease, but instead helps researchers see how social and historical factors shape who is most exposed to harmful substances.
A new starting point, not a final verdict
P.A.D.D.L.E. is delivered as an interactive web tool where scientists can choose a pollutant, a disease, or a social factor and instantly see the strongest statistical connections, maps of "hot spot" regions, and possible biological pathways based on known protein and gene targets of the chemicals. The authors stress that all of these links are correlations, not proof that any specific chemical causes a given disease. The data are based on a single year of medical visits and on ZIP code averages rather than individual exposure histories. Still, by narrowing thousands of possible pollutant–disease pairs down to a smaller set of plausible, biologically supported leads, P.A.D.D.L.E. helps researchers decide which chemicals, communities, and illnesses to study in greater depth. In that sense, it acts as a compass, pointing the way toward more focused experiments and policies that could eventually reduce pollution-related disease.
Citation: Ratley, G., Vijendra, A., Jordan, J. et al. P.A.D.D.L.E.: a hypothesis generation tool for assessing pollution’s potential role in disease. Sci Rep 16, 8808 (2026). https://doi.org/10.1038/s41598-026-39836-2
Keywords: environmental pollution, chronic disease, public health, environmental justice, exposome