Clear Sky Science · en
GCIPL color coding on OCT predicts glaucoma conversion in normal-tension glaucoma suspects, including a high myopia subgroup
Why Eye Scans Matter Before Vision Is Lost
Glaucoma is a leading cause of irreversible blindness, yet many people at risk feel perfectly fine and see normally for years. This study asks a practical question that matters to patients and eye doctors alike: when a routine eye scan already highlights potential weak spots, can those color maps tell us who is likely to stay stable and who may slowly lose vision, especially among people with very nearsighted eyes?
Simple Color Maps From a Complex Machine
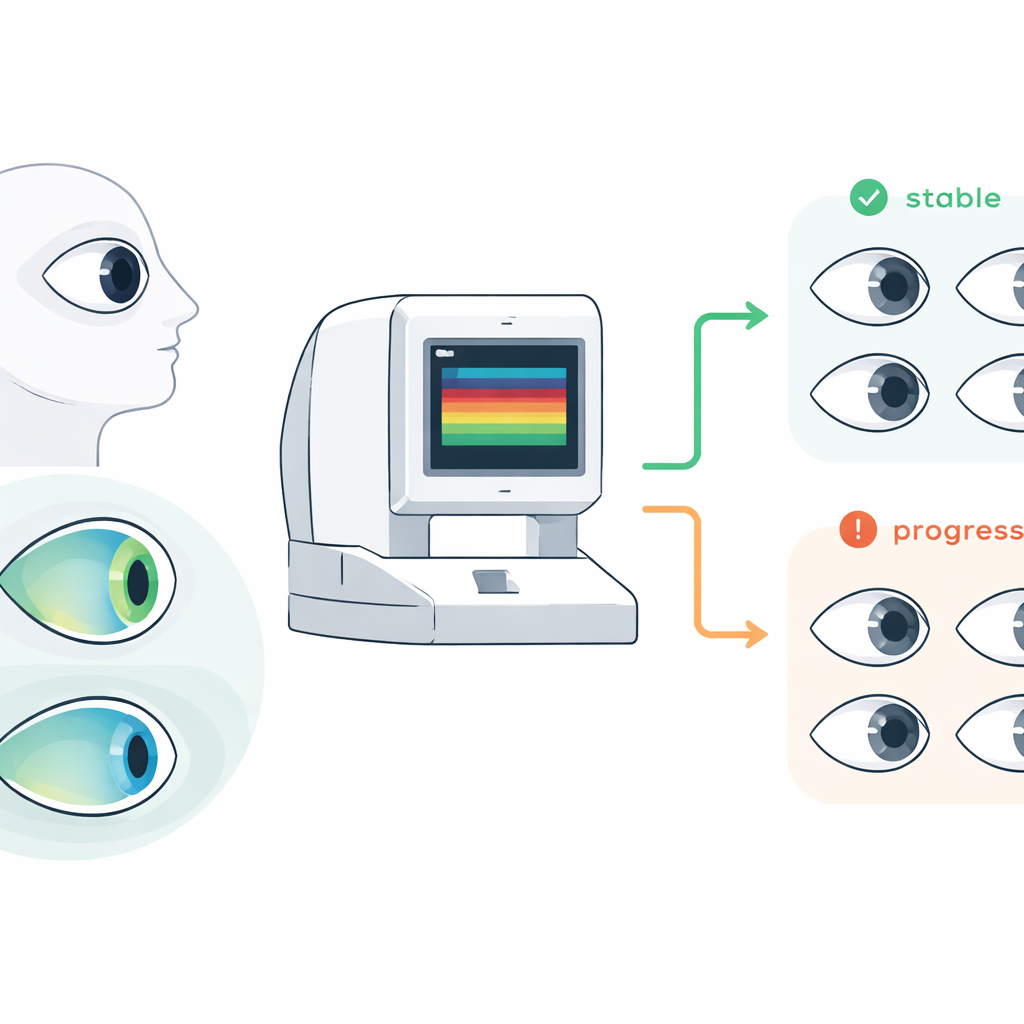
Modern eye clinics often use optical coherence tomography, or OCT, a scanner that creates cross-sectional "pictures" of the back of the eye. The device automatically compares a person’s retinal thickness to a built-in reference and displays the results as a color map: green for measurements within the usual range, yellow for borderline, and red for unusually thin areas. The authors focused on people labeled as suspects for normal-tension glaucoma, a form of the disease where eye pressure is not clearly high. All of these individuals had suspicious-looking optic nerves but still normal or near-normal visual field test results at the start.
Following Suspects Over Many Years
The researchers followed 307 eyes from 154 such suspects for about six years on average, repeating vision tests to see who eventually developed clear glaucoma-related blind spots. At the beginning, every eye had a detailed OCT scan measuring both the nerve fiber layer around the optic nerve and a key cell layer in the central retina called the ganglion cell–inner plexiform layer. The team then asked whether the baseline color codes in specific regions of these maps, especially around the lower outer (inferotemporal) portion of the macula, could predict later vision loss.
Where Thinning Shows Up Matters Most
Nearly one in four eyes went on to develop definite glaucoma during follow-up. Those that progressed tended to be from older patients, more often had high blood pressure, and already showed thinner nerve layers at baseline. The stand-out predictor, however, was thinning in the inferotemporal macular region. Eyes with red color coding in this sector were more than twice as likely to convert to glaucoma, even after accounting for other factors. Yellow (borderline) or red codes in the same area also signaled higher risk, suggesting that this region is a sensitive early warning zone where glaucoma damage often begins.
Clues in Very Nearsighted Eyes
Diagnosing glaucoma is especially tricky in highly nearsighted people because their elongated eye shape can make nerve layers look abnormally thin even when they are healthy. In this subgroup of 66 highly myopic eyes, traditional measurements around the optic nerve were less helpful. Yet the color-coded macular maps still carried clear meaning. Red codes in the average or minimum thickness of the macular layer, and in the inferotemporal sector in particular, strongly tracked with later glaucoma conversion. In these eyes, preserved thickness in that region was even more reassuring than in the overall group.
Reassuring “Green” and What It Means for Care
One of the most practical findings is that normal (green) codes in both the inferotemporal and overall macular maps strongly predicted stability. Across all eyes, about 85 percent of those with green in these areas stayed free of glaucoma over the study period; in highly myopic eyes the figure was just over 90 percent. In other words, while a red or yellow code does not guarantee that glaucoma will develop, a fully green pattern in these key sectors makes future vision loss much less likely over the next several years. The authors conclude that simple, device-generated color maps from OCT—especially in the lower outer macular region—can serve as an accessible and practical tool to help eye doctors reassure low-risk patients, prioritize closer follow-up for those at higher risk, and navigate the special challenges of assessing very nearsighted eyes.
Citation: Shin, H.J., Park, HY.L., Ryu, H.K. et al. GCIPL color coding on OCT predicts glaucoma conversion in normal-tension glaucoma suspects, including a high myopia subgroup. Sci Rep 16, 10171 (2026). https://doi.org/10.1038/s41598-026-39779-8
Keywords: glaucoma, optical coherence tomography, high myopia, macular ganglion cells, risk prediction