Clear Sky Science · en
Electric-load forecasting using interval models based on granularity and justifiable principles
Why this matters for everyday electricity use
Keeping the lights on is a delicate balancing act. Power companies must always have enough electricity ready to meet demand, but not so much that they waste fuel and money. This study explores a new way to forecast how much electricity a region will need in the future, especially over months and years, while honestly showing how uncertain those forecasts are. That matters for everyone who depends on a reliable, affordable, and increasingly low‑carbon power system.
From single guesses to safe ranges
Most traditional forecasting tools give a single number for future electricity demand, such as “the grid will need 5,000 megawatts tomorrow at 6 p.m.” These point forecasts can be very accurate for the near future, but they become shaky when looking further ahead, as demand is shaped by shifting weather, economic growth, and changing habits like electric‑vehicle charging. Newer methods using machine learning and deep learning have improved accuracy, yet they still often output a single “best guess” and usually hide uncertainty behind complex probability assumptions that are hard for operators and regulators to interpret.
Thinking in chunks instead of points
The authors propose a different mindset: instead of betting on a single number, they forecast intervals—safe ranges within which the true demand is likely to fall. To build these ranges, they use an idea known as “granular computing,” which treats data in meaningful chunks, or granules, rather than as isolated points. For electricity demand, each granule is an interval around a central value (like a daily or weekly median load) that captures how much the load can vary. Working with such granules helps smooth out random noise, makes patterns clearer across days, weeks, and months, and offers a more realistic picture of how uncertain the future really is. 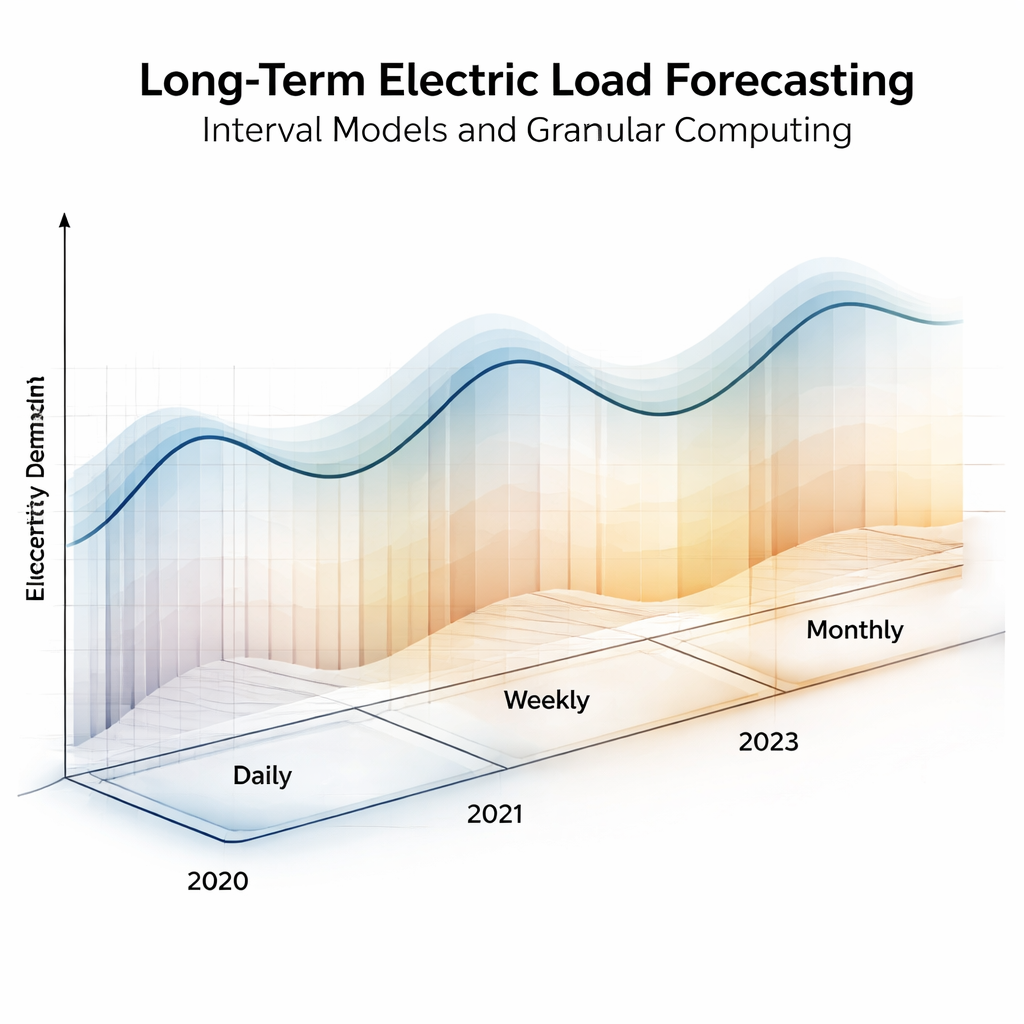
Balancing being broad enough and sharp enough
A key challenge is deciding how wide each interval should be. If it is too wide, it will almost always contain the true demand but becomes useless for planning because it is too vague. If it is too narrow, it may miss real values and give a false sense of certainty. The researchers tackle this by defining two simple measures: “coverage,” the share of actual values that fall inside a given interval, and “specificity,” a measure of how narrow and informative that interval is. They combine them into a single score called a justification index. The method then searches for intervals that maximize this score, automatically rejecting extremes—intervals so wide they explain everything and nothing, or so tight that they miss too many real data points.
Testing the idea on a real power system
To see how well this approach works in practice, the team used four years of data from Oman’s main electricity grid, measured every 30 minutes from 2020 to 2023. They built and tuned their intervals using data from 2020–2022, then checked how well those intervals captured the unseen loads in 2023. They constructed daily, weekly, and monthly intervals and compared them with more familiar forecasting tools such as regression models, decision trees, deep learning networks, and probabilistic methods like quantile regression and conformal prediction. Using an “overlap” measure, they assessed how closely the predicted intervals matched intervals built directly from 2023 data. The results showed that as they moved from daily to weekly and monthly granules, the intervals became more stable, better aligned with reality, and easier to interpret. 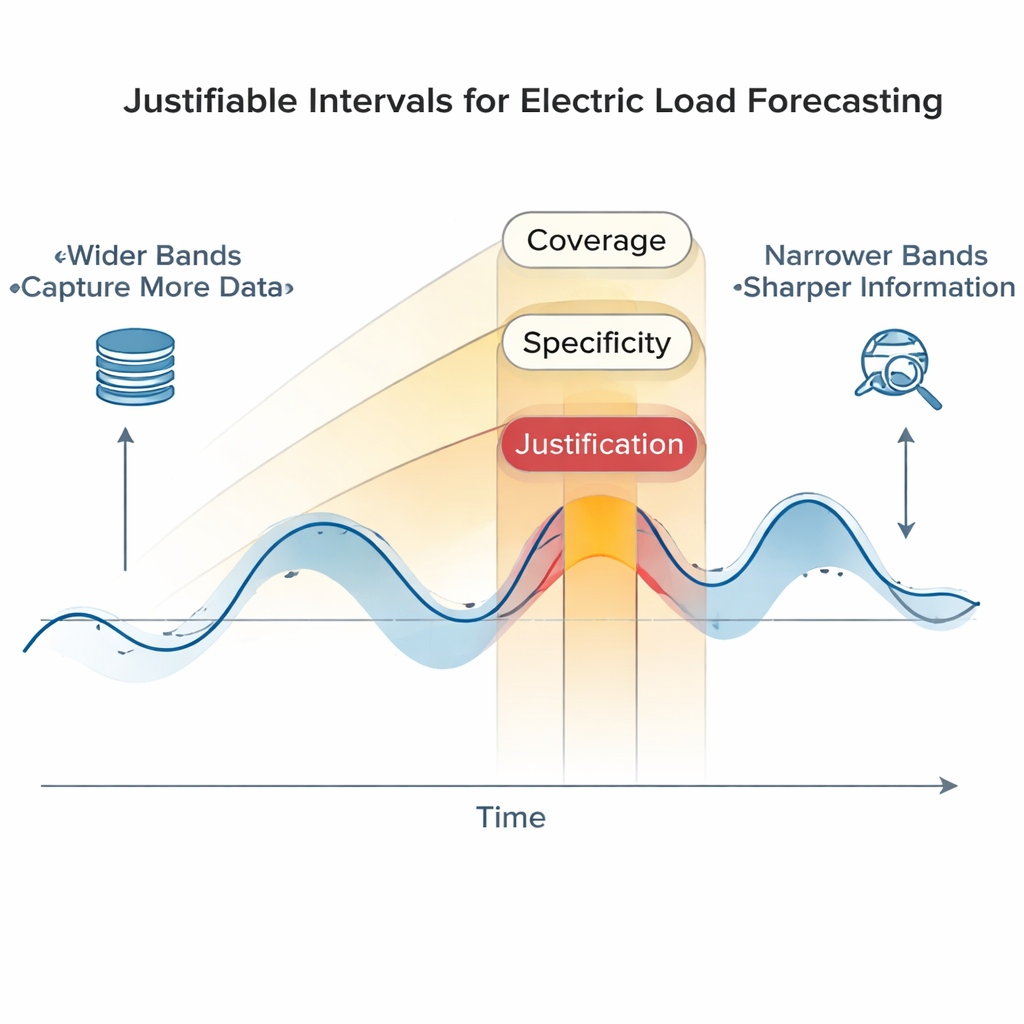
What the new intervals reveal about the grid
The analysis uncovered several practical insights. First, aggregating data over longer periods, such as weeks and months, substantially improves the reliability of forecasts, because day‑to‑day fluctuations even out. Second, the optimized intervals provided a clear and consistent match with actual demand across multiple years, suggesting that the method generalizes well instead of overfitting one particular year. Third, weekday and weekend demand in the studied system turned out to be surprisingly similar, implying that separate models for each were not necessary. When compared with other interval‑based forecasting methods, the justifiable‑granule approach delivered competitive coverage while keeping intervals reasonably tight, all without assuming any specific statistical distribution for the data.
How this helps keep the grid reliable
For non‑specialists, the main outcome is straightforward: instead of hiding uncertainty, this method makes it visible and usable. Grid operators can plan generation, reserves, and maintenance around a realistic band of likely future demand, rather than a single fragile number. The lower bound tells them how much capacity they can safely turn down, while the upper bound indicates how much backup they should keep ready for hot days, economic surges, or other surprises. By expressing uncertainty in a transparent, data‑driven way, these interval forecasts support more resilient, cost‑effective, and ultimately more sustainable power systems.
Citation: Al-Hmouz, R., Mansouri, M., Al-Badi, A. et al. Electric-load forecasting using interval models based on granularity and justifiable principles. Sci Rep 16, 7722 (2026). https://doi.org/10.1038/s41598-026-39571-8
Keywords: electric load forecasting, uncertainty intervals, granular computing, power grid planning, energy time series