Clear Sky Science · en
Enhancing digital mapping of soil organic carbon through spatial modeling and validation
Why the carbon in dirt matters to us all
Much of the planet’s carbon is quietly stored in the top layer of soil beneath our feet. This invisible reservoir helps keep our climate stable, supports crops, and protects land from erosion. Yet we still struggle to map how much carbon is in different soils, even across a single farming plain. This study from Iran shows how smarter mapping, which takes into account how nearby places tend to resemble each other, can dramatically sharpen our view of soil carbon and help guide climate‑smart, sustainable agriculture.
Looking for hidden patterns in farm soils
The researchers focused on a major agricultural plain near the city of Abyek in Iran, an area of gentle slopes, irrigated fields, and rangelands that produce staples such as wheat, barley, and corn. Over six years they collected 281 soil samples from the top 30 centimeters of ground, a layer that is especially important for plant roots and carbon storage. Each sample was analyzed for its organic carbon content, which turned out to be generally low but quite variable from place to place. The team also assembled detailed background information for every sampling location, including height above sea level, shape of the terrain, satellite‑based measures of vegetation, and local temperature and rainfall.
From classic algorithms to place‑aware learning
To turn scattered measurements into a continuous map, scientists often use machine‑learning tools such as Random Forest, which can combine many environmental factors and find complex relationships. However, these tools usually treat each data point as if it were isolated. In reality, neighboring spots on a landscape often share similar history, climate, and land use, so their soil carbon tends to be alike. This tendency for nearby sites to resemble one another is called spatial autocorrelation, and ignoring it can make maps look smoother than reality and give an exaggerated impression of accuracy. The authors tested four modeling setups that differed in how they handled this “neighbors matter” effect and how they checked their own reliability.
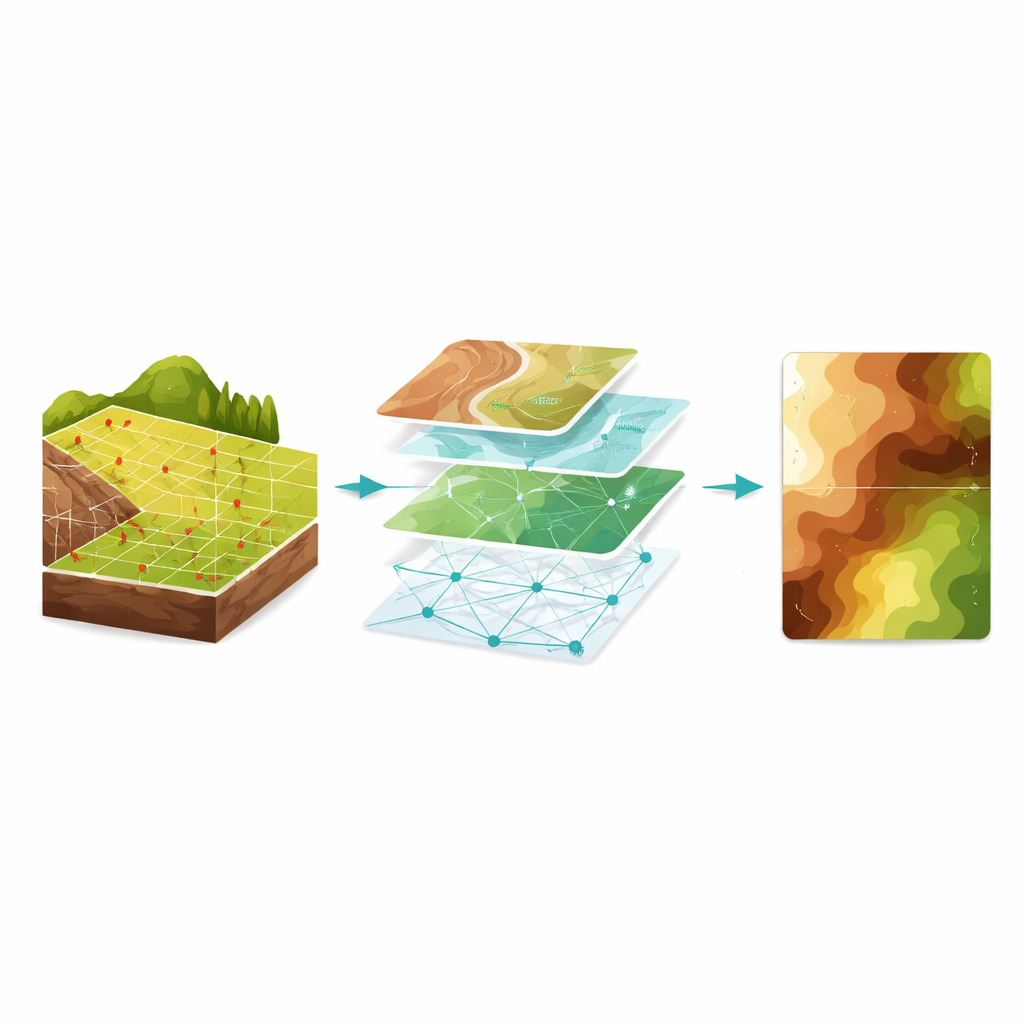
Putting space into the models
In the first scenario, the team used a standard Random Forest fed only with environmental variables like terrain and vegetation, and they evaluated it with ordinary random cross‑validation, where data are split into training and testing sets without regard to location. This model explained a fair share of the variation in soil carbon, but its errors were not randomly scattered: they formed clusters on the map, a sign that the model had missed important spatial structure. In a second scenario, the researchers added new spatial predictors derived from the distances among sampling points. This step improved accuracy somewhat and reduced, but did not remove, the clustering of errors. A third scenario changed only the way the model was tested, using a spatial form of cross‑validation that respects geographic separation between training and test points. This produced more realistic, slightly lower accuracy scores, but the underlying problem of spatially patterned errors remained.
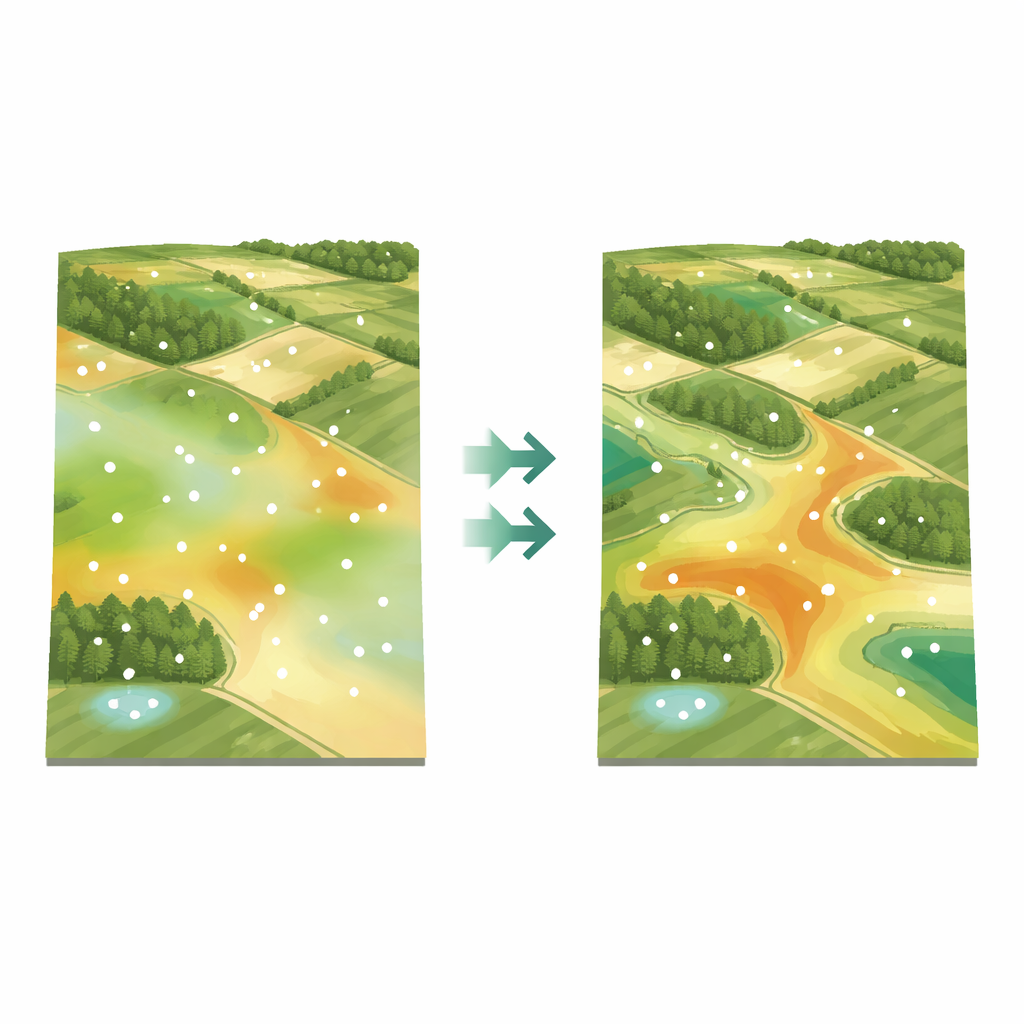
A smarter route to realistic soil carbon maps
The breakthrough came with the fourth scenario, which used a special form of Random Forest designed for spatial data. Instead of adding external spatial layers by hand, this method automatically builds internal spatial predictors based on where samples are located. With this approach, the model not only achieved the highest accuracy but also produced errors that were essentially random in space, indicating that it had successfully captured the main spatial patterns in soil carbon. The resulting map revealed sharper contrasts and more coherent zones of high and low soil carbon that matched known differences in land management and vegetation more closely than the earlier models.
What this means for farmers and the climate
For non‑specialists, the main message is that where a soil sample comes from matters just as much as what it contains. By teaching mapping tools to recognize that neighboring fields tend to behave alike, we can move from rough, potentially misleading pictures of soil carbon to maps detailed enough to guide real‑world decisions. Better maps help farmers target practices that build carbon where it is most needed, support more accurate estimates of how much carbon soils can store, and give policymakers firmer ground for climate and land‑use planning. This study shows that embracing the “geography” inside our data is a powerful and practical step toward healthier soils and a more stable climate.
Citation: Jafari, A., Sarmadian, F., Heidari, A. et al. Enhancing digital mapping of soil organic carbon through spatial modeling and validation. Sci Rep 16, 8810 (2026). https://doi.org/10.1038/s41598-026-39496-2
Keywords: soil organic carbon, digital soil mapping, spatial machine learning, carbon sequestration, sustainable agriculture