Clear Sky Science · en
GEMS satellite data fusion for hourly air quality prediction in Taiwan
Why Cleaner Air Maps Matter to Everyday Life
Air pollution is usually tracked by a sparse network of monitoring stations, which can miss hot spots and leave many neighborhoods in the dark about the air they actually breathe. This study tackles that problem for all of Taiwan by combining data from a new geostationary satellite with weather and ground sensors, then using machine learning to predict hourly levels of six major pollutants. The result is a kind of high‑resolution, real‑time air quality map that could help residents, doctors, and policymakers respond faster to changing pollution and better protect public health.
A New Eye in the Sky for Dirty Air
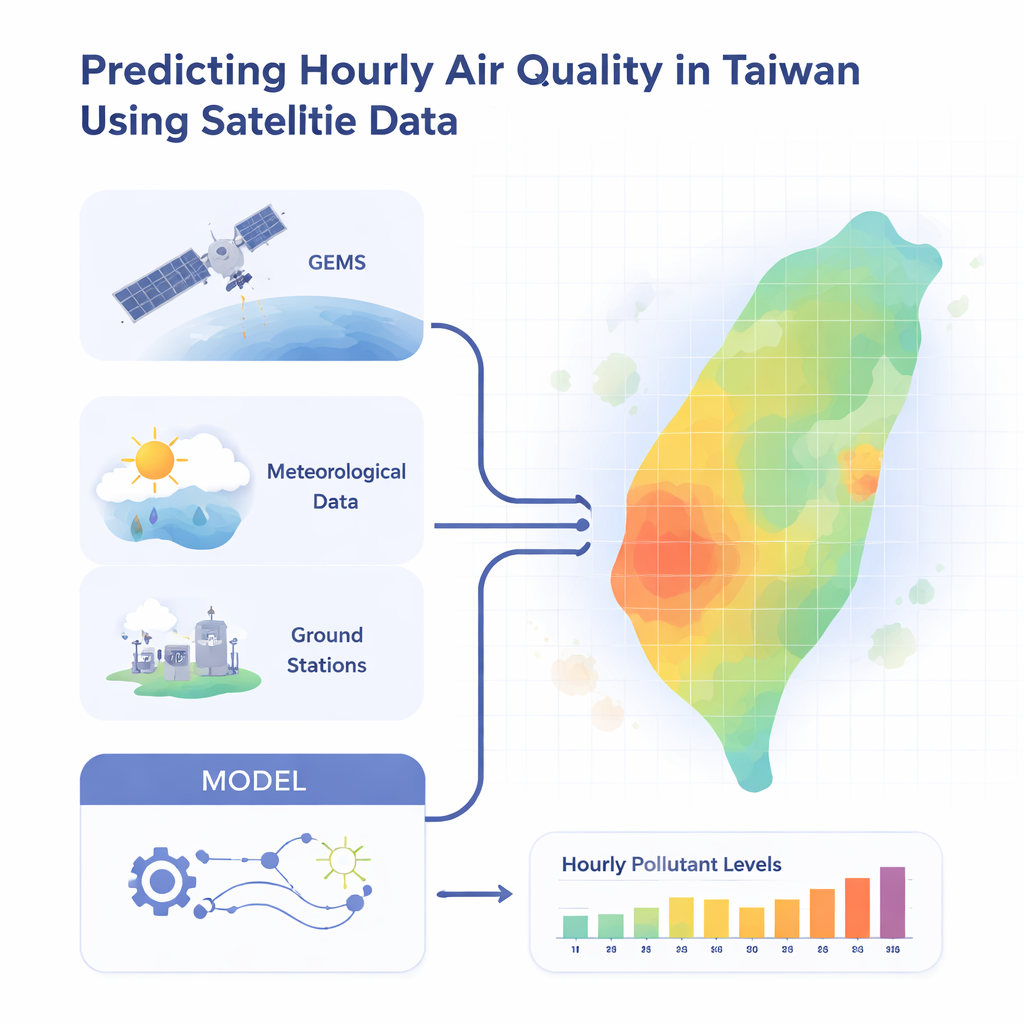
The work centers on the Geostationary Environment Monitoring Spectrometer, or GEMS, a satellite instrument launched in 2020 that hovers over East Asia. Unlike older satellites that pass over only once or twice a day, GEMS continuously watches the same region during daylight, tracking gases and particles linked to smog and haze. The researchers tapped its measurements of ozone, nitrogen dioxide, sulfur dioxide, and aerosol properties, then combined them with detailed weather information, ultraviolet radiation, and readings from Taiwan’s ground‑based air quality network. All of these data were resampled onto a common grid that covers the island, hour by hour, on a scale fine enough to distinguish regional patterns.
Teaching a Model to Follow the Air We Breathe
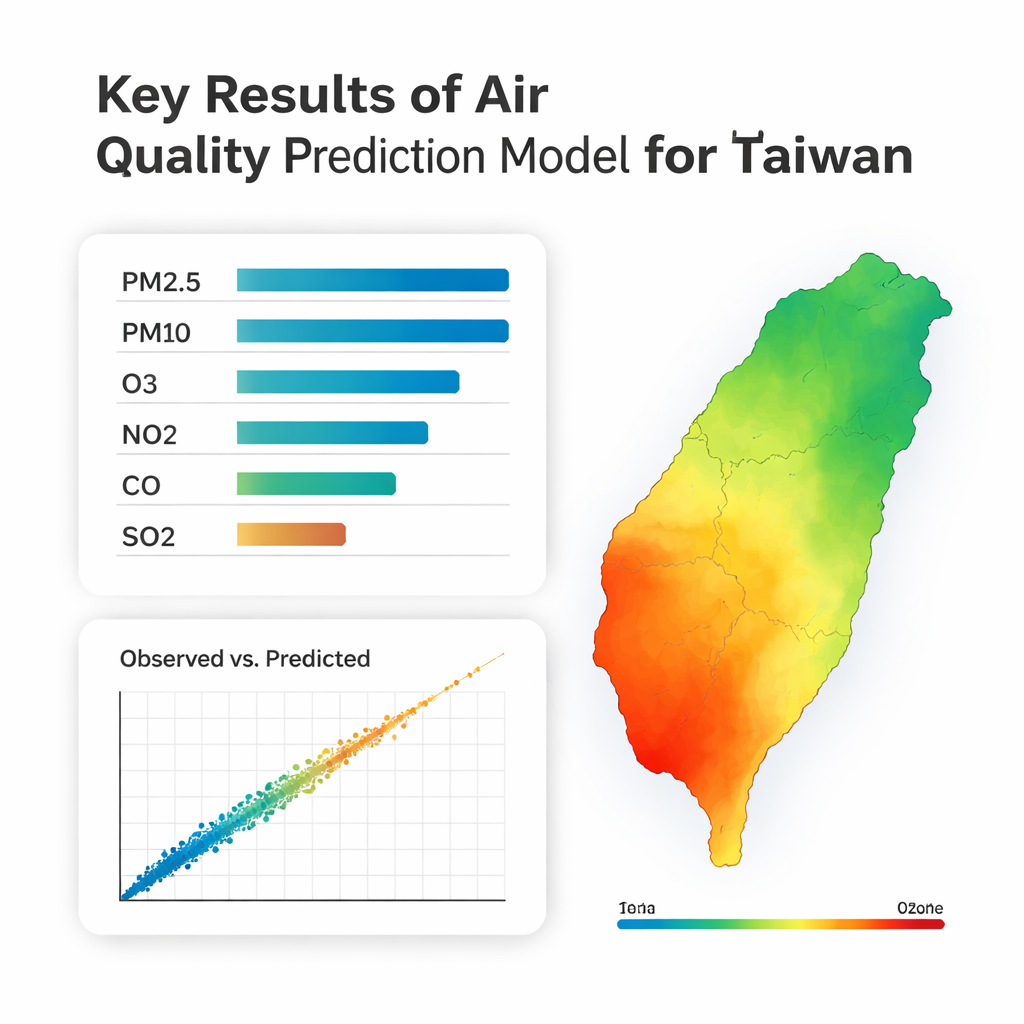
To turn this flood of data into practical forecasts, the team used a machine‑learning approach called CatBoost, which excels at finding patterns in complex, mixed‑type data. Crucially, instead of building a separate model for each pollutant, they trained a single “multi‑output” model that learns the behavior of six pollutants—fine particles (PM₂.₅), coarse particles (PM₁₀), ozone (O₃), nitrogen dioxide (NO₂), carbon monoxide (CO), and sulfur dioxide (SO₂)—all at once. The model was fed not just current satellite and weather conditions, but also information from one and two hours earlier and from the same hour on the previous day, helping it recognize short‑term swings and daily cycles. To mimic how forecasts are used in real life, they adopted a rolling approach: the model was repeatedly retrained on the most recent 18 months of data and then asked to predict the next day, over a six‑month test period in 2023.
How Well the System Tracks Taiwan’s Smog
The model proved capable of closely tracking many aspects of Taiwan’s air pollution. Statistical scores showed strong agreement between predicted and observed levels for most pollutants, especially ozone, coarse particles, fine particles, nitrogen dioxide, and carbon monoxide. Maps comparing the model’s output with station readings across Taiwan revealed that the system reproduced broad spatial patterns well, with only localized areas of over‑ or under‑estimation. An in‑depth analysis of errors highlighted that a few extreme particle pollution events, such as sudden spikes in PM₂.₅ and PM₁₀, can distort certain metrics that are sensitive to outliers. When those same errors were summarized using more robust statistics, the apparent performance for particles improved substantially, suggesting the model generally handles everyday conditions well but struggles, as many models do, with rare, intense episodes.
What Drives Pollution Patterns Over the Island
To understand what the model had learned, the researchers applied a technique that ranks which inputs matter most for each pollutant. For ozone, strong sunlight and higher temperatures pushed levels upward, while humid conditions tended to bring them down—consistent with the way plants and weather influence ozone removal. For particle pollution, higher wind speeds generally lowered concentrations by dispersing dirty air, whereas satellite‑derived aerosol signals raised them. Primary pollutants like nitrogen dioxide, carbon monoxide, and sulfur dioxide were shaped by a mix of time of day, location, and sunlight, with ultraviolet radiation lowering nitrogen dioxide as it breaks apart to help form ozone. Overall, the analysis showed that satellite measurements and meteorological data together give the model a physically sensible picture of how pollutants form, move, and fade across Taiwan’s complex island environment.
What This Means for People and Policy
In plain terms, the study shows that by fusing satellite views, weather data, and ground monitors inside a single learning framework, it is now possible to generate reliable, hour‑by‑hour maps of multiple air pollutants across all of Taiwan, not just where stations exist. While there is still room to improve performance for certain pollutants and extreme events, this approach already offers a powerful tool for public health officials and city planners: it can help issue more precise warnings during bad‑air episodes, refine long‑term exposure estimates used in health studies, and support smarter regulations targeting the most harmful combinations of pollution and weather. The same strategy could be adapted to other regions covered by geostationary satellites, bringing clearer, more timely pictures of the air we breathe to many more communities.
Citation: Lin, WH., Chan, TC. GEMS satellite data fusion for hourly air quality prediction in Taiwan. Sci Rep 16, 7766 (2026). https://doi.org/10.1038/s41598-026-39305-w
Keywords: air quality forecasting, satellite remote sensing, Taiwan air pollution, machine learning models, GEMS satellite