Clear Sky Science · en
Integrated GIS and AHP framework for groundwater potential mapping in a Himalayan foothill district of Northeast India
Why Hidden Water Matters Here
In the Himalayan foothills of northeast India, many families depend on wells and hand pumps for drinking, cooking, and growing crops. Yet even in places that receive heavy monsoon rains, taps can run dry in the dry season. This study focuses on Baksa District in Assam, asking a deceptively simple question: where, beneath this rugged landscape, is groundwater easiest to find and sustain? By combining satellite data, digital maps, and a structured decision method, the researchers build a practical guide to the district’s underground water potential and how it varies from steep hills to flat plains. 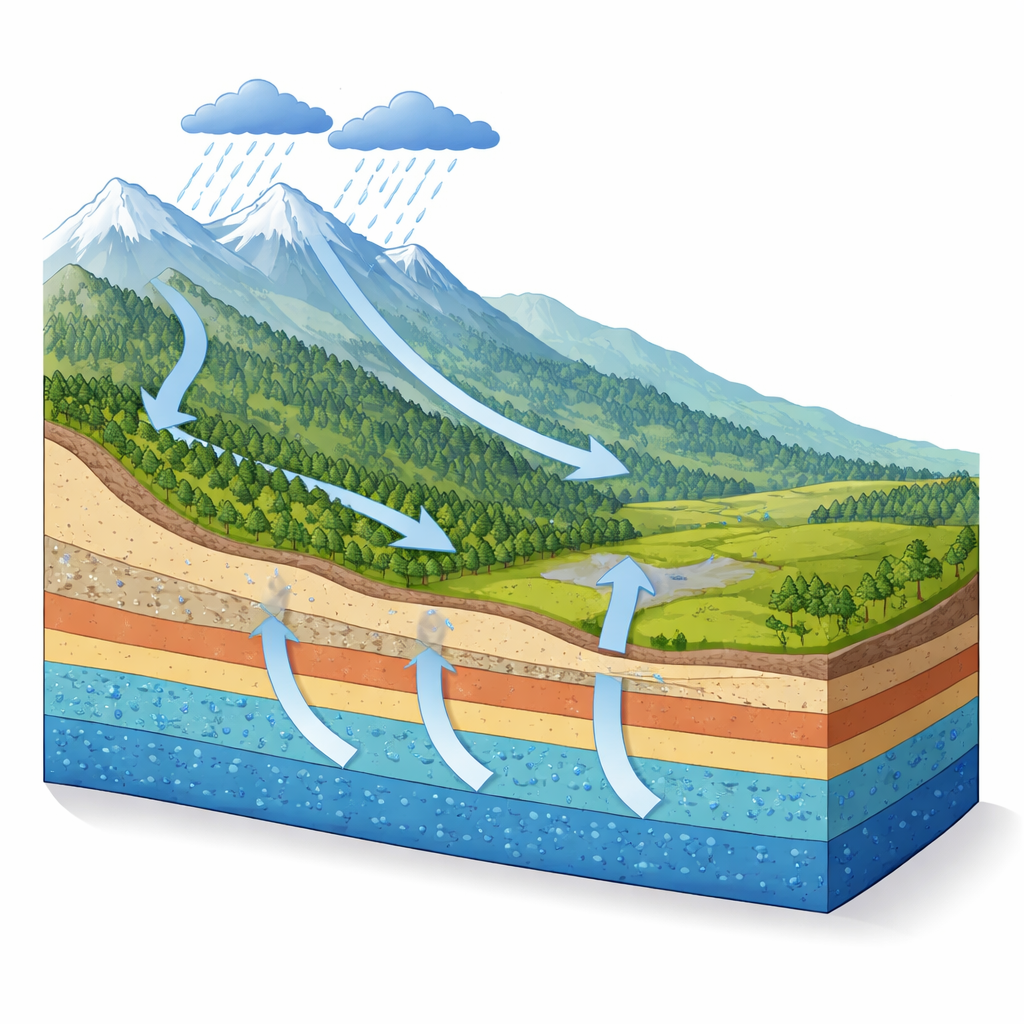
The Landscape Behind the Wells
Baksa District stretches from the high, rain‑lashed Bhutan foothills in the north down to broad alluvial plains by the Brahmaputra River in the south. Most people here are smallholder farmers, and nearly two thirds of the land is used for crops such as rice, maize, pulses, oilseeds, and fruits. Although the region receives almost three meters of rain a year, the water does not soak in evenly. In the northern belt, steep slopes, coarse rocky deposits, and fast‑flowing streams quickly carry rainfall away, making it hard for aquifers to refill. Further south, the land flattens into gently sloping plains with deeper, finer sediments that can store more water. Understanding this north–south transition is crucial for deciding where wells will be reliable and where extra recharge efforts are needed.
Reading the Ground with Digital Maps
Traditional groundwater surveys rely on drilling and field measurements, which are expensive and sparse in remote foothill terrain. Instead, the authors turned to an integrated mapping approach using Geographic Information Systems (GIS). They assembled seven key layers that influence groundwater: the types of rocks and sediments, the presence of fractures and faults, how dense the stream network is, the steepness of slopes, the kind of soil, how the land is used (forest, crops, buildings, water bodies), and how much rain falls across the district. Each layer was derived from sources such as satellite images, digital elevation models, government soil and geology maps, and long‑term rainfall records, and then standardized so they could be combined on a common grid.
Weighing What Matters Most
Because some landscape features matter more for groundwater than others, the team used the Analytical Hierarchy Process, a structured decision tool, to assign relative importance to each factor. Experts compared the seven layers in pairs, asking questions such as, “In this terrain, is rainfall or slope more important for recharge, and by how much?” From these comparisons they calculated numerical weights and checked that the judgments were consistent. Rainfall emerged as the single most influential factor, followed by slope and the density of fractures in the rock, which act as pathways for water to move underground. Gentle slopes, fractured rock, coarse or sandy soils, forest and vegetated cover, and thick alluvial deposits all raised the score for groundwater potential, while steep hills, tightly packed crystalline rock, dense stream networks, clay‑rich soils, and built‑up areas lowered it.
Mapping Better and Worse Places for Wells
Using a weighted overlay of all seven layers, the researchers produced a Groundwater Potential Index for every location in the district and grouped the results into five classes from “very low” to “very high” potential. The western and central plains, marked by gentle terrain, permeable soils, and a favorable balance of rainfall and runoff, make up about 41.5% of the area and fall into the high or very‑high category. Transitional foothill zones in the middle of the district mostly show moderate potential, where seepage and runoff are more evenly balanced. The northernmost belt of steep foothills and some localized built‑up patches are classified as low to very low potential, despite receiving some of the heaviest rain. To test the map, the authors compared it with water‑level measurements from 11 monitoring wells and used statistical tools to see how well the predicted potential matched observed depths. The agreement was strong, indicating that the map reliably reflects real‑world conditions. 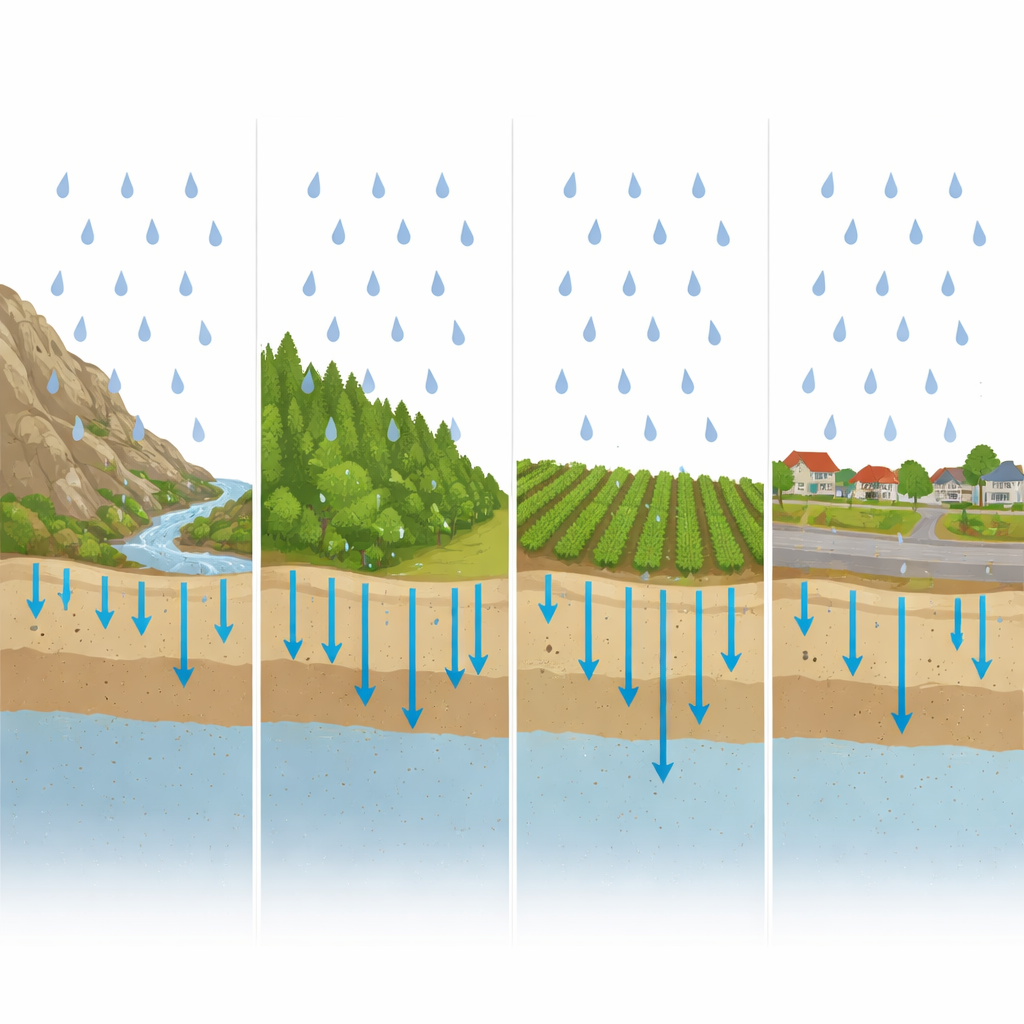
Turning Maps into Water Security
For residents and planners in Baksa and similar Himalayan foothill districts, the study’s message is both hopeful and cautionary. There is substantial scope—over two fifths of the area—for safely developing groundwater in zones where nature already favors recharge, especially on the central and western plains. At the same time, the work shows that heavy rainfall alone does not guarantee secure wells: terrain, soil, rock type, and land use strongly condition how much water actually makes it underground. By clearly identifying where underground reserves are likely to be rich, moderate, or poor, the GIS‑AHP framework offers a practical tool for choosing well sites, planning artificial recharge structures, and guiding land‑use decisions that support long‑term water security in this rain‑fed yet water‑stressed region.
Citation: Basumatary, S., Maji, S. Integrated GIS and AHP framework for groundwater potential mapping in a Himalayan foothill district of Northeast India. Sci Rep 16, 8291 (2026). https://doi.org/10.1038/s41598-026-39210-2
Keywords: groundwater mapping, Himalayan foothills, GIS and remote sensing, water resource planning, Assam Baksa district