Clear Sky Science · en
CiCLoDS: Joint cell clustering and gene selection for single-cell spatial transcriptomics
Finding Neighborhoods in the City of Cells
Modern microscopes can now read out which genes are active in hundreds of thousands of cells while keeping each cell in its original place inside a tissue. This “spatial transcriptomics” revolution is like turning a blurry city map into a street‑level view of every house. But there is a catch: these maps contain measurements for thousands of genes per cell, far more than scientists can easily interpret or afford to measure in follow‑up experiments. This study introduces CiCLoDS, a new method that finds meaningful cellular neighborhoods and, at the same time, picks a small, interpretable list of genes that define those neighborhoods.
A Smarter Way to Shrink Big Data
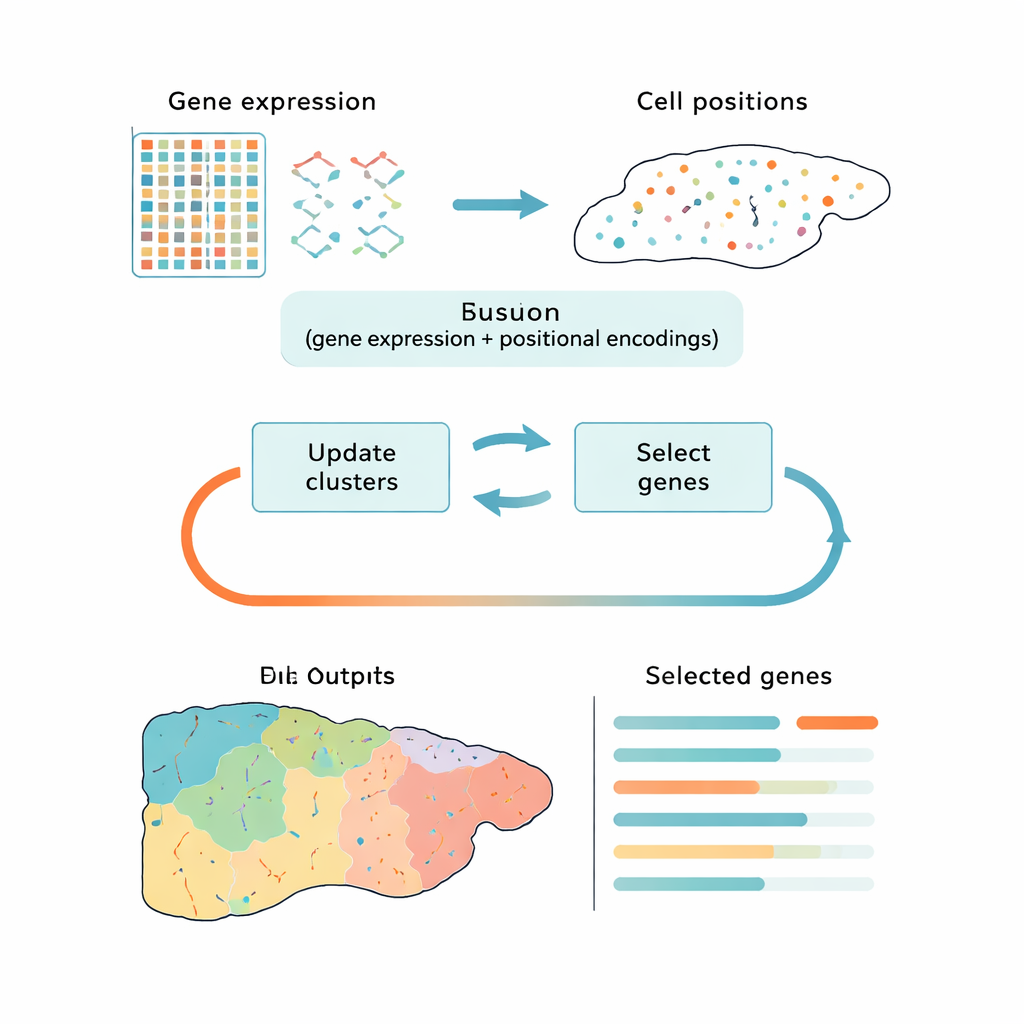
Most current tools handle this challenge in two disconnected steps: first they reduce the data to a simpler form, then they group cells into clusters. Popular approaches like principal component analysis (PCA) preserve overall variation but may focus on technical noise or generic cell‑cycle signals rather than the biological differences that matter. Other methods use deep learning to find patterns, but they act as black boxes and do not clearly say which genes are most important. CiCLoDS takes a different route. It treats gene selection and clustering as one joint problem under a user‑defined “budget” for how many genes can be kept. In effect, it asks: which limited set of genes best explains how cells fall into distinct groups, given both their gene activity and, when available, their physical positions in the tissue?
From Math to Maps of Real Tissues
The authors adapt a family of mathematically transparent techniques called subspace clustering to the realities of spatial transcriptomics, where datasets can contain over a million cells. CiCLoDS works on a simple cell‑by‑gene table, assigning cells to clusters while scoring each gene for how much it helps separate those clusters. It can also weave in spatial information by adding positional “encodings” that describe where each cell sits in the tissue, without changing the core optimization. On large mouse liver and human colon datasets generated by high‑resolution imaging platforms, CiCLoDS runs in minutes on standard computers and produces compact gene panels—on the order of a few dozen to a few hundred genes—that still capture the rich structure of the original data.
Revealing Hidden Zones and Blood Vessels
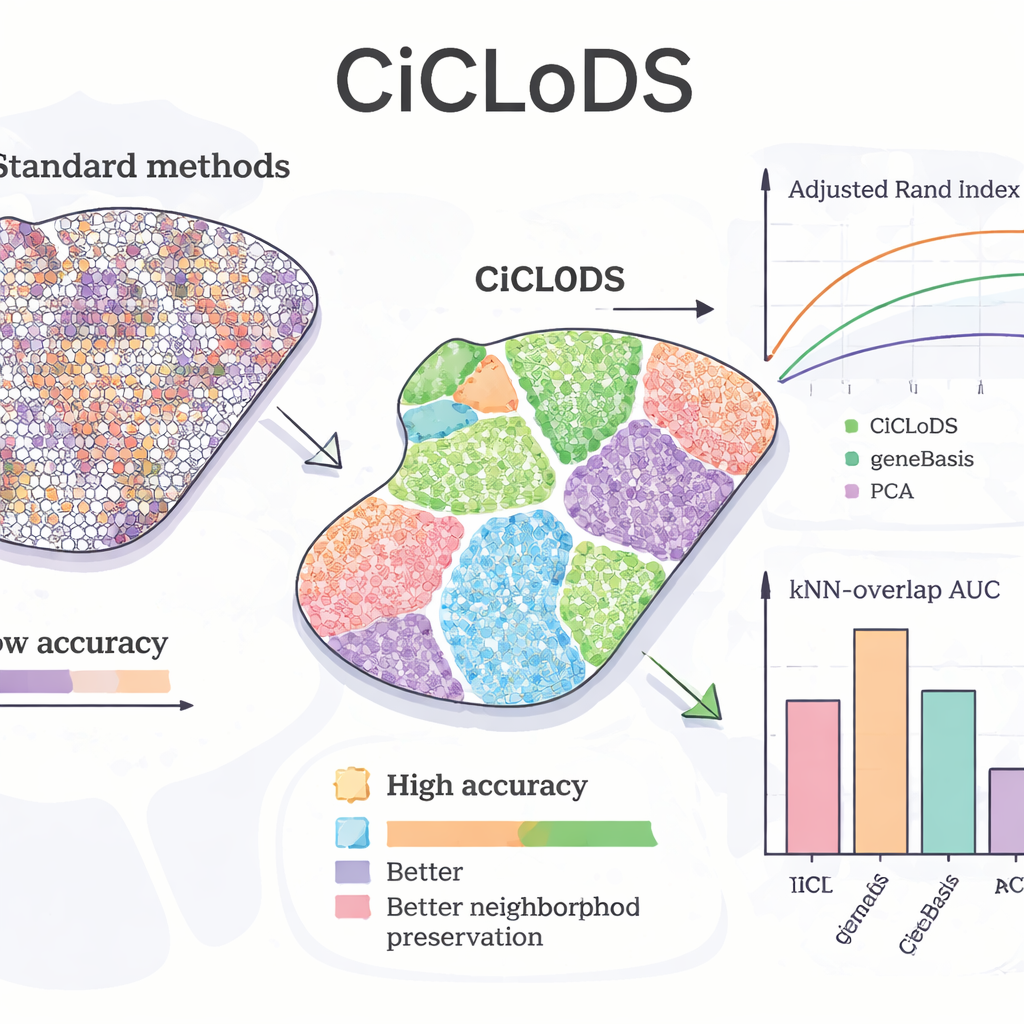
Applying CiCLoDS to mouse liver, the team asked whether the method could recover known “zonation” patterns—gradual shifts in hepatocyte function from one side of the lobule to the other. Compared to PCA and a leading gene‑selection tool called geneBasis, CiCLoDS produced cleaner spatial zones with sharper boundaries and far fewer misassigned regions, as seen in quantitative metrics that measure agreement with a reference map. Remarkably, when allowed to use more genes, CiCLoDS rediscovered peri‑portal‑like and peri‑central‑like hepatocyte groups that closely matched expert‑defined reference clusters, even though it was not told about the key biomarker gene AXIN2 or given explicit spatial coordinates. When spatial encodings were added, CiCLoDS also learned gene panels enriched for cell‑surface and vessel‑related functions and could accurately distinguish real blood vessels from imaging artifacts—something simpler methods either failed at or achieved only with more ad‑hoc tweaks.
Generalizing Across Brains and Boosting Other Methods
To test whether CiCLoDS holds up across very different tissues and individuals, the authors analyzed human dorsolateral prefrontal cortex samples from three donors. Here, CiCLoDS performed on par with or better than specialized spatial methods such as BayesCafe and BayesSpace, particularly on a difficult sample where the other tools struggled. The study also highlights a “hybrid” use: running CiCLoDS first to get stable clusters, then feeding those into BayesSpace. This warm‑start strategy raised overall accuracy and produced brain layer patterns that best matched expert annotations, showing that CiCLoDS can both stand alone and make downstream probabilistic models more reliable.
Why This Matters for Biology and Medicine
For non‑specialists, the key takeaway is that CiCLoDS turns overwhelming cellular maps into concise, biologically meaningful summaries. Instead of working with thousands of noisy measurements, researchers get a manageable list of genes and clear spatial clusters that reflect real tissue organization—metabolic zones in liver, blood vessels and their niches, and layered structures in the brain. Because the gene budget is user‑controlled and the computations are lightweight, CiCLoDS can help design targeted gene panels for future experiments, guide interpretation of complex spatial datasets, and provide robust starting points for more elaborate modeling. In an era where the bottleneck is no longer data collection but understanding, tools like CiCLoDS promise to make high‑dimensional tissue maps both practical and insightful.
Citation: Wang, N., He, Y., Ray, E. et al. CiCLoDS: Joint cell clustering and gene selection for single-cell spatial transcriptomics. Sci Rep 16, 5356 (2026). https://doi.org/10.1038/s41598-026-39168-1
Keywords: spatial transcriptomics, cell clustering, gene panel selection, tissue architecture, single-cell analysis