Clear Sky Science · en
Benchmarking imputation strategies for missing time-series data in critical care using real-world-inspired scenarios
Why filling in data gaps matters for ICU patients
In modern intensive care units, every heartbeat, breath, and blood pressure pulse is recorded as a continuous stream of numbers. Yet in real life, these streams are full of holes: sensors fall off, patients leave the bed for scans, and devices are briefly turned off. When doctors and computers use these incomplete records to forecast a patient’s future or guide treatment, how we "fill in" those missing pieces can subtly change the story the data tell. This study asks a practical question with big implications: among a wide range of gap-filling strategies—from simple straight lines to state-of-the-art artificial intelligence—which ones work best under the kinds of data gaps that actually happen in ICUs?
Taking a closer look at ICU vital signs
The researchers drew on MIMIC-IV, a large public database of de-identified ICU stays from a U.S. hospital. They focused on 26,167 adult stays and examined the first 48 hours after ICU admission, tracking four vital signs that are continuously monitored at the bedside: heart rate, blood oxygen level, breathing rate, and mean blood pressure. To keep the signals realistic, obviously impossible readings were removed, and all measurements were summarized once per hour. Any hour with no recorded value for a given vital sign was treated as missing. Although only about 4% of all values were absent, the team found that these gaps were not sprinkled at random—they often clustered later in the 48-hour window and sometimes affected several vital signs at once.
How real-world data gaps were recreated
Instead of inventing purely artificial patterns of missing values, the authors built three scenarios inspired by what they observed in the raw data and what clinicians see at the bedside. In the first, individual readings were randomly deleted, mimicking occasional lost measurements. In the second, 1- to 3-hour blocks across all four vital signs vanished together, representing times when a patient is away from monitors—for instance, during a scan. In the third, a single vital sign—for example, blood pressure—was removed for a continuous 4-hour stretch, echoing a failed sensor or a dislodged probe. Each scenario removed about 30% of the data, posing a serious test for any method that aims to reconstruct the original curves.
Old tricks versus modern machine intelligence
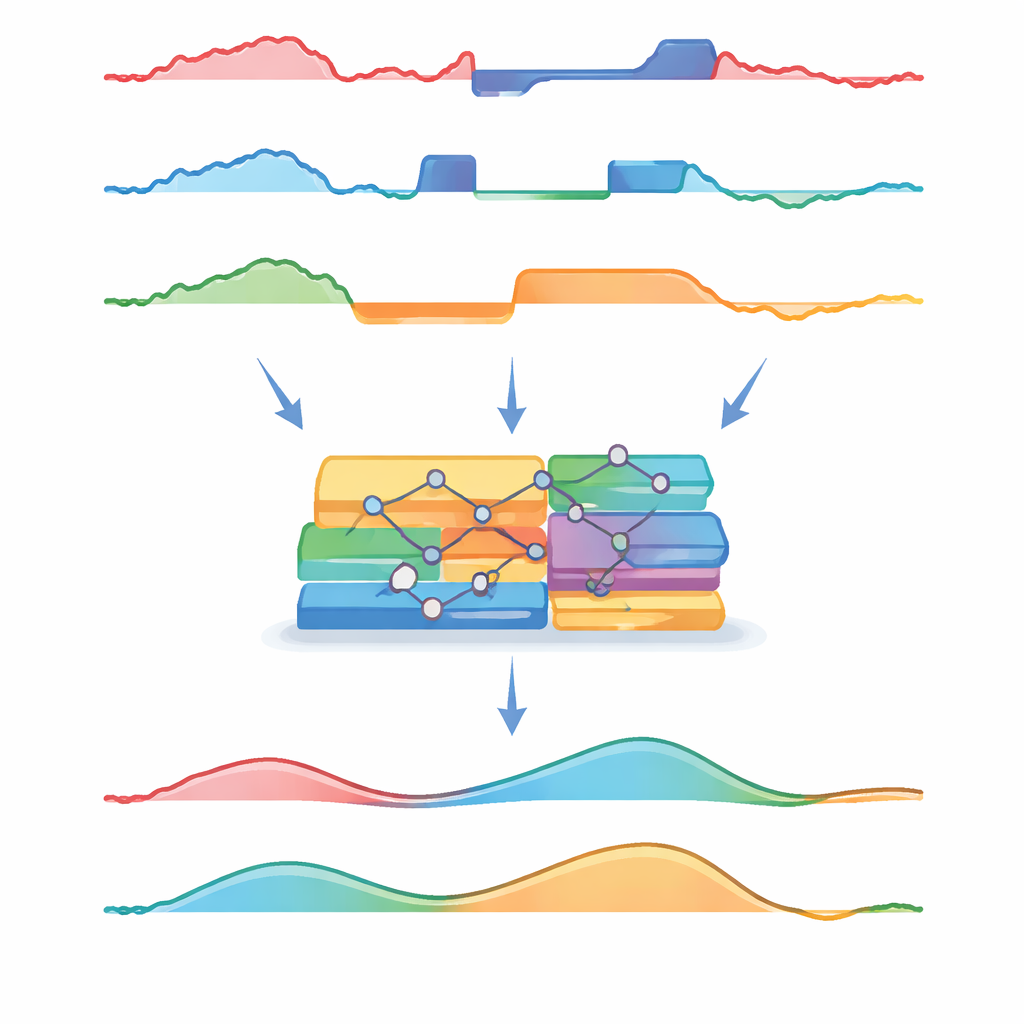
The team then pitted a broad set of reconstruction methods against one another. Simple standbys included filling each gap with a patient’s average value, carrying forward the last observed reading, or drawing a straight line between the nearest known points. More advanced statistical tools tried to predict missing values from the other vital signs, but in doing so, they had to flatten the time dimension and treat each hour as just another row in a table. At the other end of the spectrum were deep learning models—Transformers, recurrent networks, and generative models—that explicitly learn patterns over time and across variables. All models were trained on data where 30% of values were randomly hidden, then challenged on each of the three masking scenarios. Performance was judged by how far their reconstructions strayed from the original numbers, with special attention to errors in mean blood pressure, a crucial signal for managing circulation.
What worked, when, and by how much
Overall, the most sophisticated models—particularly a Transformer-based approach and a generative adversarial network—delivered the lowest average errors, especially when gaps were short or scattered. However, a humble method—straight-line interpolation—performed strikingly well, coming close to these neural models in many situations. Statistical tools that ignored the order of measurements, such as random forests and chained equations, lagged behind despite their complexity. The shape of the gaps also mattered. When values were missing at random, all methods looked better, giving an overly optimistic picture of their accuracy. Long, continuous holes in the record, especially across several hours or a single failed sensor, proved much harder to fill correctly. In these tougher settings, the best deep learning methods degraded more gracefully than simple approaches, but gains were often modest when translated into actual blood pressure units.
Why the findings matter for bedside decisions
For everyday blood pressure ranges, the difference between the top deep learning models and straightforward interpolation was often just a few millimeters of mercury—typically too small to alter a doctor’s decision. Yet all methods, including the most advanced, struggled when blood pressure was very low or very high—the very moments when careful monitoring matters most. The study concludes that choosing how to handle missing ICU data is as much about understanding how and where gaps occur as it is about picking the latest algorithm. Sophisticated models can offer incremental gains, particularly for longer or more complex gaps, but simple, transparent methods may be more than adequate for many practical uses. Crucially, better gap-filling does not automatically guarantee better predictive models; future work must test how these reconstruction choices ripple through to real clinical decisions.
Citation: Poette, M., Mouysset, S., Ruiz, D. et al. Benchmarking imputation strategies for missing time-series data in critical care using real-world-inspired scenarios. Sci Rep 16, 8116 (2026). https://doi.org/10.1038/s41598-026-39035-z
Keywords: ICU time-series, missing data, imputation methods, deep learning, vital signs