Clear Sky Science · en
Accumulated local effects and graph neural networks for link prediction
Why understanding hidden links matters
Many of the systems that shape our lives—social media, scientific collaborations, brain networks, even the web itself—can be described as networks of connected points. A key question is which new connections are likely to form in the future, such as who will collaborate with whom or which paper will cite which. Modern graph neural networks are powerful tools for this kind of “link prediction,” but they are also black boxes: they work well, yet it is hard to see why they make a given decision. This paper tackles that problem by adapting a general explanation technique so we can see how changing a single property of a node affects the chances that links to it will appear.
From simple scores to opaque graph brains
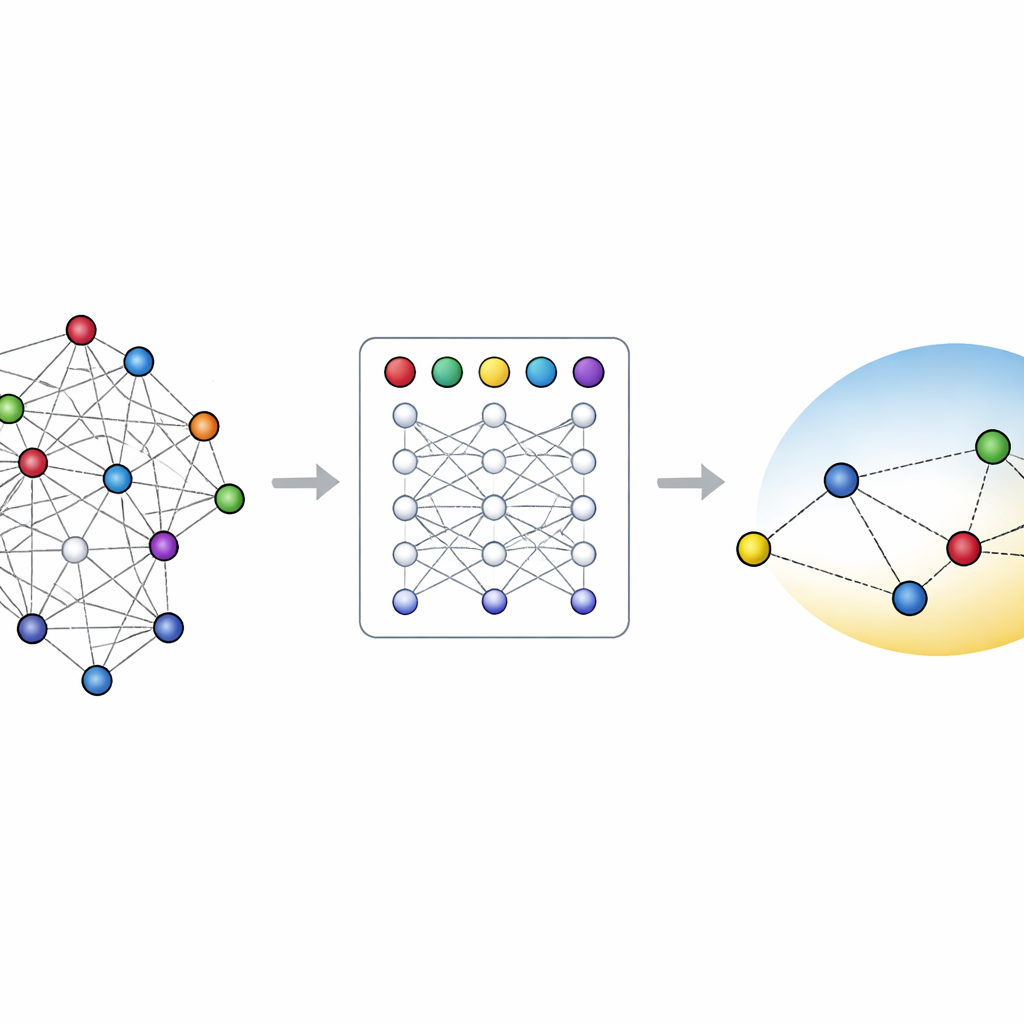
Early network science relied on simple rules to guess missing or future links. For instance, two people with many common friends are more likely to become friends themselves, and highly connected web pages tend to attract even more links. Over the past decade, these hand-crafted scores have been surpassed by methods that learn compact numeric descriptions, or embeddings, of each node. Graph neural networks go a step further: they repeatedly pass messages along the links so that each node’s embedding collects information from its neighbors and their neighbors. This makes them excellent at link prediction but also means their inner workings are tangled and hard to interpret.
Seeing how a single feature nudges predictions
Outside the world of graphs, one popular way to interpret black-box models is called Accumulated Local Effects (ALE). Instead of just saying which features are important, ALE asks how the model’s prediction changes as you nudge one feature up or down across its possible values, and then accumulates these local changes into a smooth curve. The authors adapt ALE to link prediction with graph neural networks by altering the feature of one node at a time and checking how the predicted probability of links between that node and many others responds. This produces a visualization that shows, for example, how increasing the share of “Big Tech” authors on a paper or changing the vertical position of a vessel segment in the brain shifts the model’s estimated chance of a connection.
Two ways to compute effects: exact and fast
Graph neural networks add a twist to ALE: when you change many nodes at once, they can influence one another through message passing, potentially distorting the explanation. The authors therefore compare two strategies. In the “exact” version, each node’s feature is modified in isolation, so no two altered nodes can contaminate each other’s embeddings—but this is computationally expensive. In the “approximate” version, many nodes are changed at the same time, treating the data more like an ordinary table and ignoring these interactions; this is much faster but may introduce bias. By systematically varying how many nodes are modified and how many potential partners they are tested against, the authors measure how these choices affect the ALE curves.
Testing on synthetic graphs and real data
To probe accuracy, the team first builds a synthetic network where the true rule governing link formation is known: edges are more likely when a special “signal” feature is high for both endpoints. Here, they can compare ALE curves directly to the ground truth. They find that as more nodes are modified at once, the approximate method drifts away from the true relationship, while the exact method stays faithful. On large real-world datasets—a citation network of artificial intelligence papers and a detailed 3D map of mouse brain blood vessels—they can no longer see the true rule, so they use the exact method, aggregated over many runs, as a gold-standard explanation and check how far the approximate method strays. Statistical tests and permutation experiments show that, in most model–dataset combinations, differences between the two methods are modest, though the approximate curves are more variable from run to run.
What these effects reveal about the world
Beyond methodology, the ALE curves offer glimpses into what the models have actually learned. In the citation network, they indicate that papers with a higher fraction of authors affiliated with large technology companies are more likely—according to the model—to receive citations, echoing concerns about the growing influence of industry in AI research. In the vessel graph, two different graph neural network architectures learn opposite trends for how a vessel’s height in the brain relates to its connectivity, underlining that ALE exposes the model’s beliefs, not necessarily biological truth. Such mismatches can flag places where the model architecture, training data, or evaluation may need rethinking.
Takeaway for readers and practitioners
The study shows that Accumulated Local Effects can be reshaped to explain link predictions in graph neural networks, offering intuitive curves that show how changing a node feature pushes link probabilities up or down. Computing these curves exactly is more reliable but slower, while a faster approximation is often good enough if one can tolerate some extra noise, especially when averaging over many runs. For people who already use explanation tools on standard machine-learning models, this brings a familiar, visual way to peer into complex graph-based systems and to question whether what the model has learned really matches our understanding of the networks we care about.
Citation: Kaczyńska, P., Sienkiewicz, J. & Ślęzak, D. Accumulated local effects and graph neural networks for link prediction. Sci Rep 16, 8574 (2026). https://doi.org/10.1038/s41598-026-39000-w
Keywords: graph neural networks, link prediction, model explainability, accumulated local effects, network science