Clear Sky Science · en
A pilot study on protocol consistency and graph metric reproducibility in microstructure-weighted connectomes
Why the Brain’s Wiring Map Needs a Reliability Check
Doctors and scientists increasingly look at the brain as a giant map of wiring, where regions talk to each other through bundles of nerve fibers. New MRI-based methods can turn this wiring into mathematical networks that may reveal early signs of diseases like multiple sclerosis or Alzheimer’s. But before such measurements can guide diagnosis or treatment, we need to know something basic: if we scan the same healthy brain more than once, or on different scanners with slightly different settings, do we get essentially the same network back?
From Water Motion to Maps of Brain Highways
To build these wiring maps, the authors use a form of MRI that tracks how water molecules move in brain tissue. In white matter, where long, insulated nerve fibers run together, water prefers to move along the length of the fibers rather than across them. By measuring this direction-sensitive motion in many orientations, computer algorithms can infer bundles of fibers and assemble a “connectome” – a matrix that records which gray-matter regions are linked by which white-matter pathways. Instead of simply counting how many virtual fibers are reconstructed between regions, this study focuses on “microstructure-weighted” connectomes, where each connection is colored by properties of the tissue itself, such as how orderly the fibers are or how densely packed they appear.
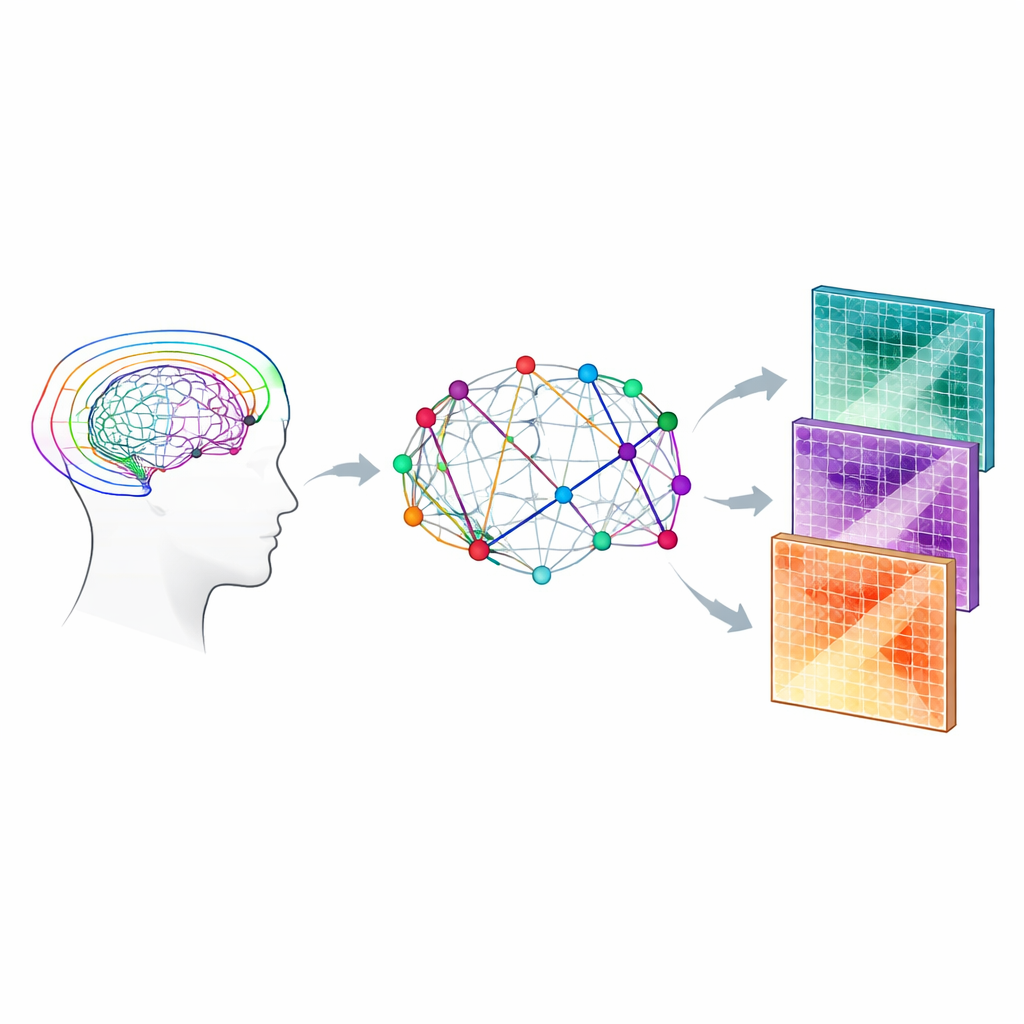
Adding Biological Detail to the Network
The team combined two families of models that interpret the diffusion MRI signal. The first, diffusion tensor imaging, summarizes how directional the water motion is and how fast it diffuses on average. The second, called Bingham-NODDI, goes a step further by estimating how much of each tiny volume of tissue is made up of water inside nerve fibers, outside them, or in fluid-filled spaces. Using a relatively rich “four-shell” scanning protocol designed to better capture complex fiber geometry, they calculated several microstructural parameters, including fractional anisotropy and mean diffusivity (from the tensor model) and intra-neurite and extra-cellular volume fractions (from Bingham-NODDI). These parameters were then propagated along each reconstructed fiber bundle and combined to give a biologically informed weight to every connection in the network.
Putting the Pipeline to the Test
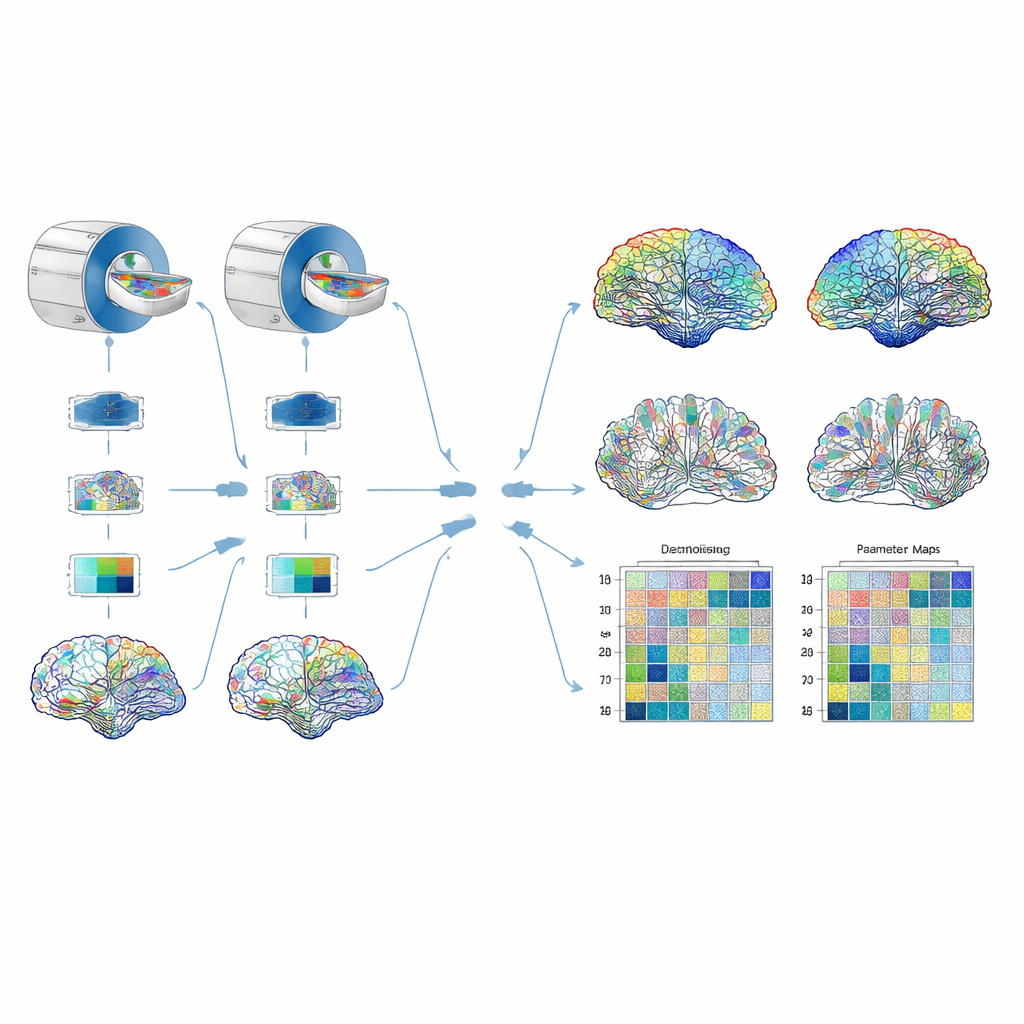
Reliability was assessed in three complementary ways. First, the researchers repeatedly scanned a carefully designed physical phantom – a tangle of synthetic fibers in salty water that mimics key features of brain tissue – to test how stable the parameters were over short periods. Next, they scanned four healthy volunteers at two hospitals, using the same brand and model of MRI scanner and the same settings, to probe differences between sites. Finally, they compared the four-shell protocol against a shorter, more conventional two-shell protocol, asking whether both gave similar parameter values. For the brain data, they reconstructed multiple versions of the connectome weighted by different parameters and extracted graph measures such as overall network efficiency, how clustered the connections are, and how strongly each region connects to the rest of the brain. They then checked how much these measures changed from site to site and how much of the variation reflected real differences between people rather than measurement noise.
What Turned Out to Be Trustworthy
Several key tissue measures proved remarkably consistent. Fractional anisotropy, mean diffusivity, and the intra-neurite and intra-cellular volume fractions varied by less than five percent across repeated scans, different sites, and (for most regions) between the two- and four-shell protocols. In contrast, quantities describing how spread out fiber orientations were – and a related “concentration” parameter – were more erratic and were therefore excluded from network construction. When the researchers built connectomes weighted by the most stable measures, many network properties, including density, global efficiency, average clustering, and mean connection strength, were reproducible across sites. One exception was modularity, a measure of how cleanly the network falls into distinct communities; this was notably more sensitive to small changes in the underlying weights. Connectomes weighted by extra-cellular volume performed worst overall, with several graph measures showing poor agreement between sites.
Why This Matters for Brain Health
The study shows that it is not enough to count reconstructed fibers when searching for markers of disease in the brain’s wiring. By carefully selecting stable microstructural parameters to weight each connection, researchers can build richer, biologically grounded networks whose key properties are repeatable across scanners and protocols. Within the tested conditions, connectomes weighted by fractional anisotropy, mean diffusivity, and intra-neurite volume appeared robust enough that their basic network statistics could serve as candidate biomarkers in disorders that disturb brain connectivity. At the same time, the work flags more fragile measures, such as modularity and some advanced microstructural indices, as features that should be treated cautiously until larger, multi-center studies confirm their reliability.
Citation: Cavallo, M., Ricchi, M., Axford, A. et al. A pilot study on protocol consistency and graph metric reproducibility in microstructure-weighted connectomes. Sci Rep 16, 8288 (2026). https://doi.org/10.1038/s41598-026-38964-z
Keywords: brain connectivity, diffusion MRI, connectome, network reproducibility, microstructure imaging