Clear Sky Science · en
A comprehensive web-based platform for calculation of abiotic stress tolerance indices in plant breeding
Why this matters for future harvests
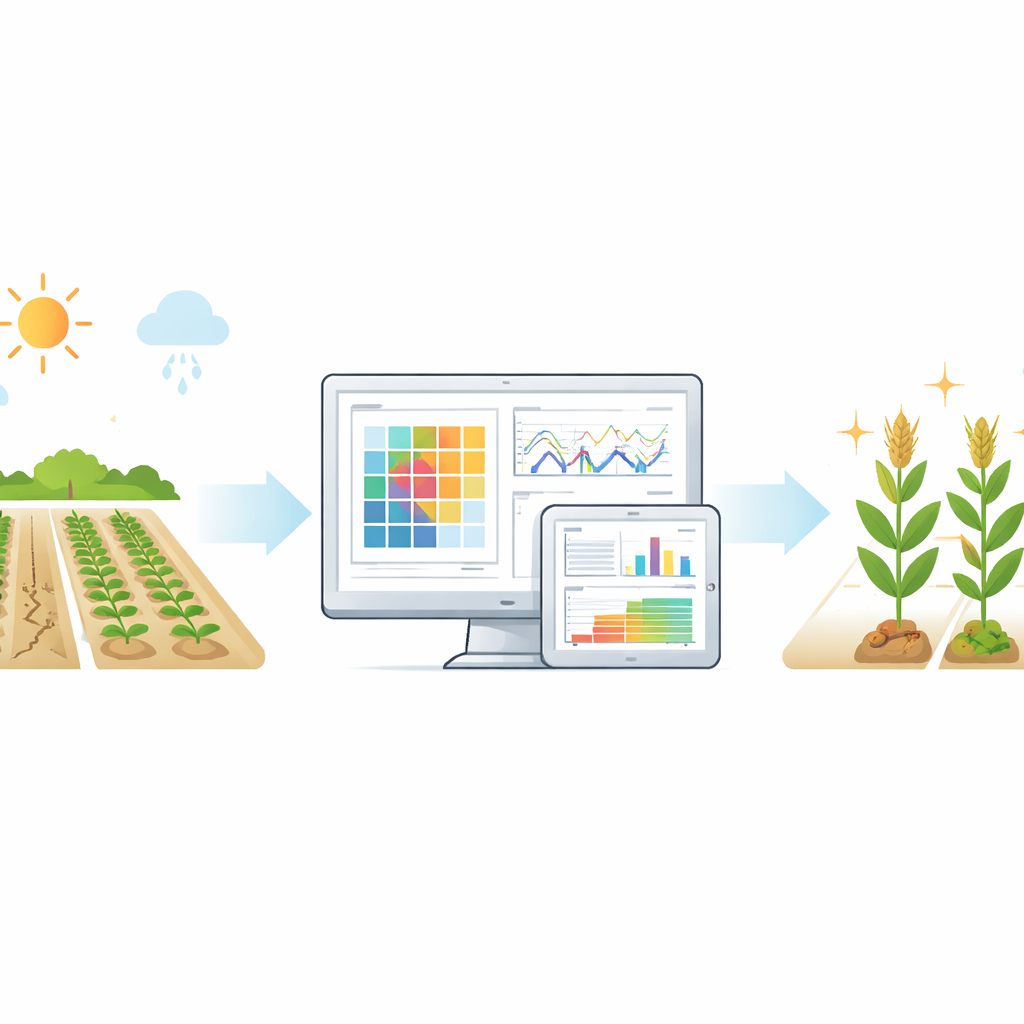
As heatwaves, droughts, and salty soils become more common, many farmers are watching their crops struggle. Plant breeders are racing to develop new varieties that can survive these harsher conditions, but judging which experimental plants truly handle stress best is surprisingly hard. This article introduces PTSIonline, a free web tool that turns complex measurements from field trials into clear rankings of which crop lines cope well with tough environments—helping speed up the search for climate‑resilient crops.
Turning messy field data into clear answers
When breeders test dozens or hundreds of crop varieties under both normal and stressful conditions, they collect large tables of numbers—such as grain yield with and without heat or drought. Over the past forty years, scientists have invented many formulas, called stress indices, that combine these numbers to describe how tolerant or sensitive each variety is. But calculating 15 to 20 indices for hundreds of entries by hand or in spreadsheets is slow, error‑prone, and often beyond the comfort zone of many breeding teams. Existing online tools cover only a subset of the most common indices and can bog down when datasets get large.
A web tool built for busy breeders
PTSIonline (Plant Tolerance and Sensitivity Indices online) was created to remove these bottlenecks. Researchers upload a simple Excel file listing each genotype and its performance under non‑stress and stress conditions. In seconds, the platform computes 18 widely used indices that capture different aspects of performance: overall productivity, loss under stress, stability across environments, and combined scores. Behind the scenes, a Python‑based engine uses efficient numerical libraries to process even 1,000 genotypes quickly, while a modern web interface guides users through the process without requiring programming skills or specialized statistics software.
From indices to insight, not just numbers
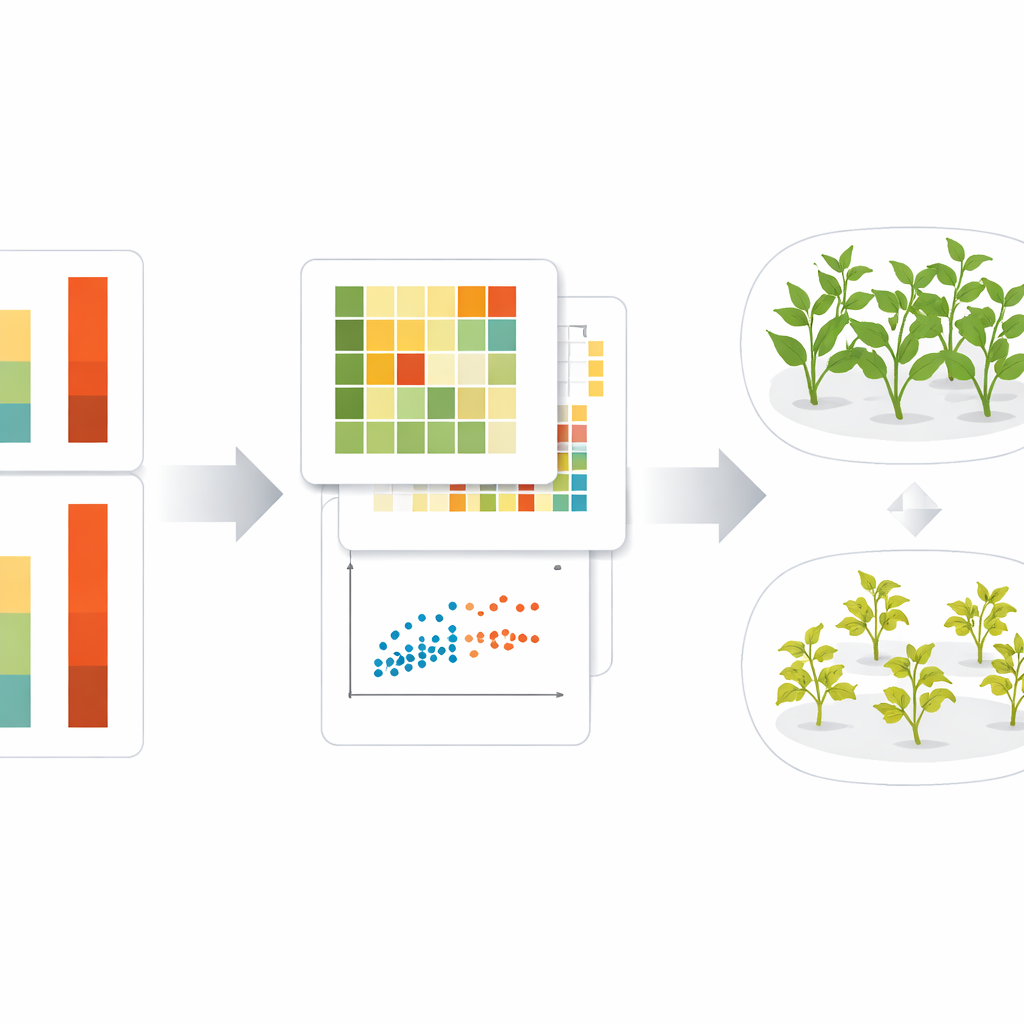
Beyond raw calculations, PTSIonline helps users interpret what the indices mean. It groups the 18 measures into six “families,” such as productivity‑based or stress‑tolerance‑based, and recommends choosing one or two from each rather than leaning on a single favorite formula. The system automatically runs correlation analyses and principal component analysis, then displays heatmaps, bar charts, histograms, and three‑dimensional plots. These visuals show which indices behave similarly, which capture distinct information, and how genotypes cluster into performance groups, helping breeders avoid redundant criteria and focus on the most informative indicators.
Putting the tool to the test in real wheat fields
To demonstrate the platform, the authors analyzed data from 30 wheat lines grown in Iran under normal conditions and under intense end‑of‑season heat. Using PTSIonline, they rapidly calculated all 18 indices, summarized their distributions, and ranked each genotype. The tool highlighted several wheat lines that combined high yields with strong performance under stress, marking them as especially promising for hot regions. It also exposed cases where a particular index, such as a modified tolerance score, appeared to overrate a genotype that actually had low yield under stress—showing how important it is to view indices together rather than in isolation.
Robust, transparent, and ready to reuse
The authors paid particular attention to data quality and reproducibility. The platform checks for missing, negative, or non‑numeric values and alerts users before running any calculations. Tests with noisy datasets confirmed that outliers and zeros are handled in a controlled way, and repeated runs with the same data always produced identical results. All tables and plots can be downloaded for further analysis or direct inclusion in reports and scientific papers, making it easy to trace how each ranking was obtained.
What this means for climate‑smart agriculture
For non‑specialists, the key message is straightforward: PTSIonline is a calculator and visualization engine that helps plant breeders quickly sort large numbers of crop varieties into “stress‑tolerant” and “stress‑sensitive” groups using proven quantitative methods. By automating tedious math and packaging advanced graphics into a browser‑based tool, it lowers the barrier to using sophisticated stress indices in real breeding programs. While it does not replace other considerations like disease resistance or grain quality, it gives breeders a sharper lens for seeing how plants withstand drought, heat, or other harsh conditions—an essential step toward securing harvests in a changing climate.
Citation: Jalili, A., Sabouri, H. & Shoaei, Z. A comprehensive web-based platform for calculation of abiotic stress tolerance indices in plant breeding. Sci Rep 16, 7995 (2026). https://doi.org/10.1038/s41598-026-38957-y
Keywords: plant stress tolerance, climate-resilient crops, web-based breeding tools, stress indices, high-throughput phenotyping