Clear Sky Science · en
Estimating species commonness and prevalence through unsupervised methods
Why counting common and rare species matters
When we picture nature at risk, we often think of rare animals on the brink of extinction. Yet most of the living fabric around us is made of very ordinary creatures that are either common or quietly disappearing before anyone notices. Being able to tell how widespread a species really is in a given place is essential for predicting how ecosystems will respond to pollution, land use, or climate change. This paper introduces a way to estimate how common or rare many species are at once, using only existing sighting records and modern data analysis. The goal is to provide more objective inputs for computer models that predict where species can live now and in the future.
From simple sightings to big ecological questions
Ecologists routinely use computer models, called ecological niche models, to work out which environments are suitable for a species. These models help forecast where a species might turn up under changing climate or in new regions. A crucial ingredient is “prevalence” – roughly, the share of surveyed sites where a species is present. It encodes whether a species is expected to be common or rare before any new surveys happen. That prior expectation strongly shapes how models convert raw suitability scores into probabilities of presence and how they draw lines between “present” and “absent” on a map. If prevalence is guessed poorly, especially for rare species, predictions can be misleading and conservation plans may focus on the wrong places.
Letting the data speak for hundreds of species
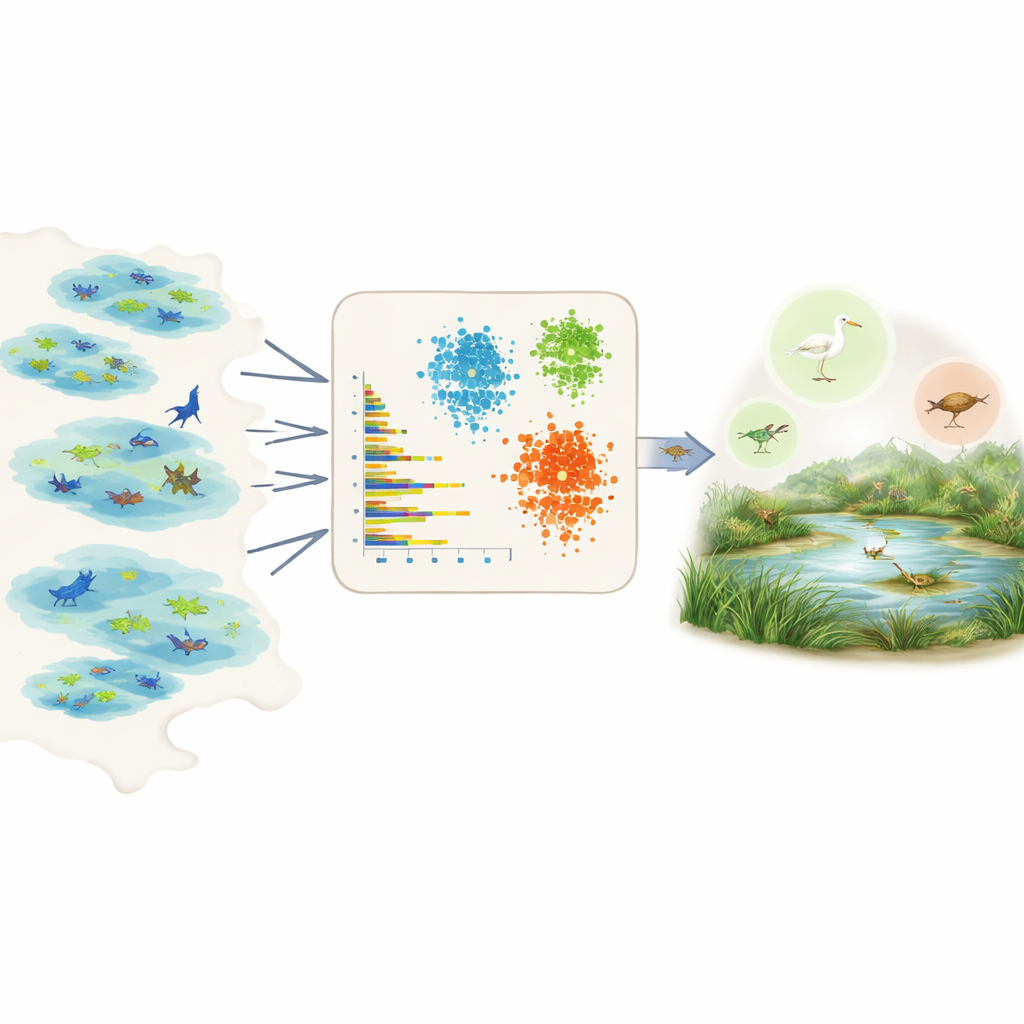
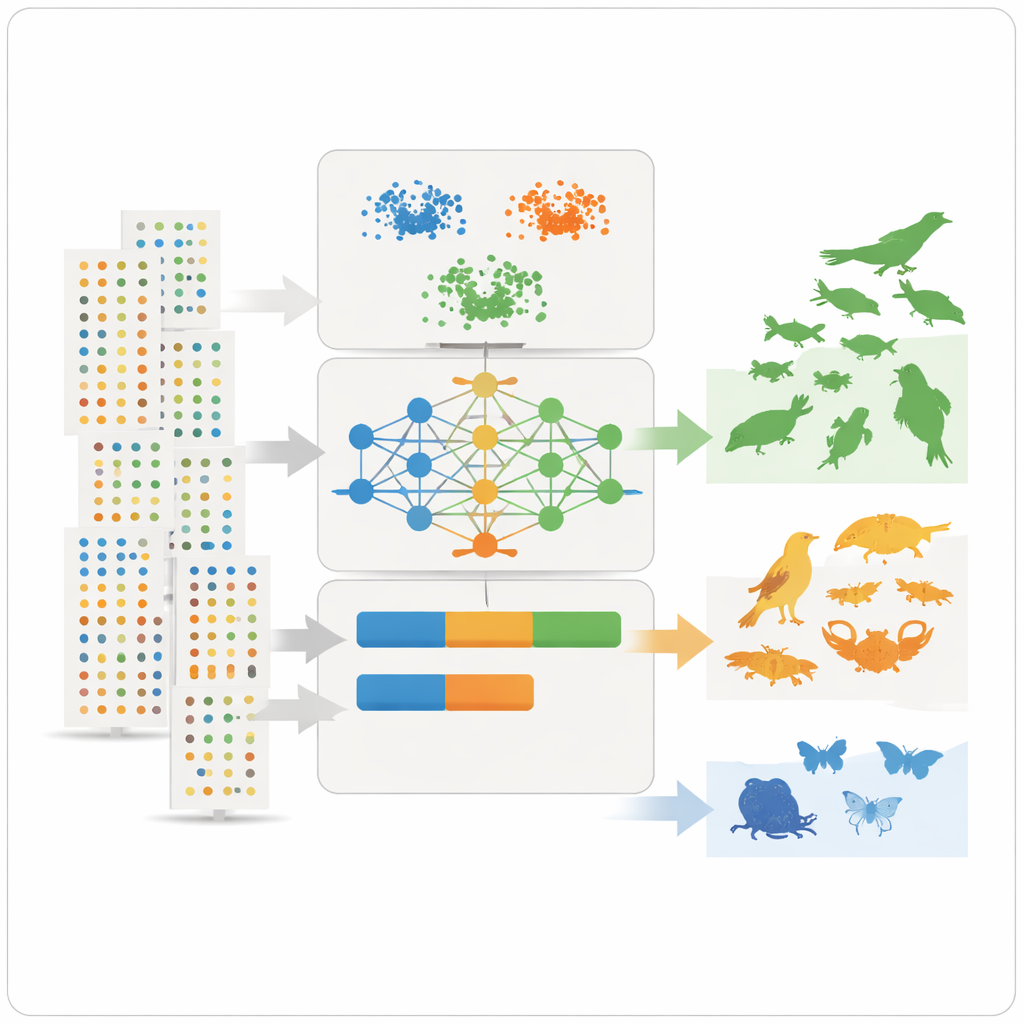
Directly measuring prevalence is hard because field data are patchy and biased. Some areas are heavily surveyed, some species are easier to see, and many records come from citizen science projects with uneven effort. Rather than relying on expert opinion or detailed knowledge for each species, the authors tap into the Global Biodiversity Information Facility, a huge open database of species observations. For each species in a chosen region, they summarise the raw records into a handful of simple, comparable numbers: how many individuals are usually reported per sighting, how many different datasets or wetlands contain the species, how widespread it is within those wetlands, and how frequently it is observed over time, including how often there are bursts of many observations.
Teaching machines to sort common and rare species
With these summary features in hand, the team applies three unsupervised learning tools – two clustering methods and a deep learning model known as a variational autoencoder – that look for patterns without being told beforehand which species are common or rare. The clustering methods group species that share similar abundance, spread, and observation frequency. The autoencoder learns what a “typical” species record looks like and flags unusual patterns as anomalies, which often correspond to rare or poorly observed species. The models then assign each species to three intuitive classes – very common, fairly common, or rare – and convert those classes into numerical prevalence values that can plug directly into ecological niche models as prior probabilities.
Testing the approach in a vulnerable wetland
To see how well this framework works in practice, the authors focus on the Massaciuccoli Lake basin in Tuscany, Italy, a low-lying wetland rich in birds, fish, insects, and other animals. This landscape is both a biodiversity hotspot and a tourist magnet, but it is also vulnerable to climate change, water shortages, and pollution. For 161 animal species linked to the lake, the models were trained using records from other Italian wetlands, then asked to infer how common each species should be in Massaciuccoli. Two local experts, with deep field experience in the area, independently rated the same species. Comparing the two sides, the deep learning model agreed with the combined expert view for about 81–90 percent of the species, while the clustering methods and an ensemble of all three also performed well.
Learning from disagreements and hidden biases
Not every case lined up perfectly. A few species well known to experts as abundant around the lake appeared rare in the data, often because they are elusive, underreported, or more closely watched in some wetlands than others. This highlighted a key limitation: big databases mirror where and how people look for nature, not just where species truly occur. A sensitivity analysis showed which features mattered most for the classifications, with the average number of records per dataset, the abundance per sighting, and the consistency of observations over years emerging as especially informative. Despite remaining biases, the method produced clear, reproducible prevalence estimates and can be tuned to use finer or coarser classes depending on modelling needs.
What this means for future nature forecasts
For non-specialists, the main message is that we can now use existing biodiversity data more intelligently to gauge which species are likely to be common, middling, or rare in a given setting, without hand-tuning each case. By turning noisy observation records into transparent, data-driven prevalence estimates, the framework helps ecological models make more realistic predictions of habitat suitability and future biodiversity trends. That, in turn, can support better planning for wetlands like Massaciuccoli and many other ecosystems worldwide, even when field data are incomplete and expert time is limited.
Citation: Bove, P., Bertini, A. & Coro, G. Estimating species commonness and prevalence through unsupervised methods. Sci Rep 16, 8331 (2026). https://doi.org/10.1038/s41598-026-38900-1
Keywords: species prevalence, biodiversity modelling, wetland ecosystems, machine learning ecology, species commonness