Clear Sky Science · en
Assessing the impact of open-circuit voltage estimation methods on UKF performance for lithium-ion battery SOC and SOH estimation
Why Better Battery Gauges Matter
Anyone who drives an electric car, uses a smartphone, or relies on home energy storage depends on a tiny number on a screen: how much battery is left, and how worn out that battery has become. Behind that simple display lies a complex estimation problem. This paper explores a key piece of that puzzle—how we model the relationship between a battery’s resting voltage and its charge level—and shows that choosing the right method can make on‑board "battery gauges" faster, more accurate, and better at tracking long‑term health.
Two Ways to Listen to a Battery
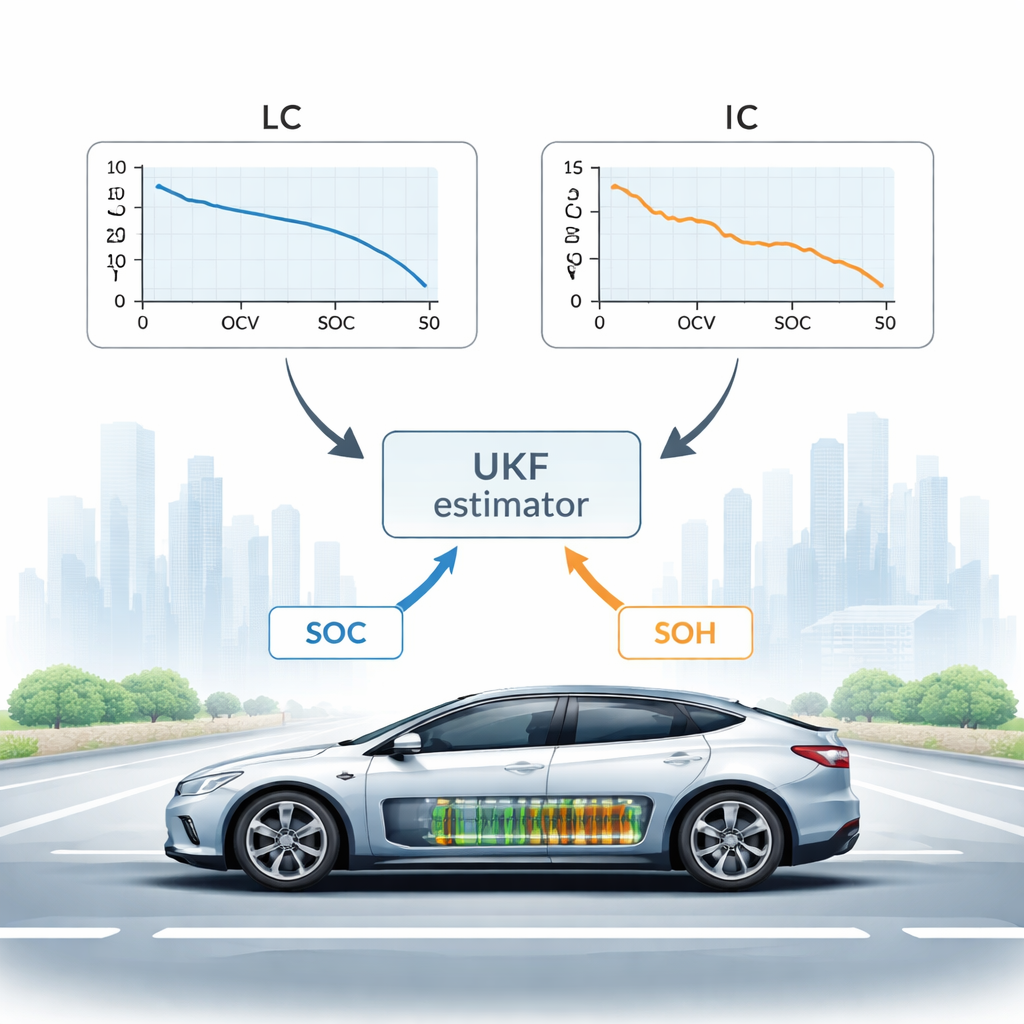
To estimate how full a lithium‑ion battery is, engineers lean on a curve that links open‑circuit voltage (the battery’s voltage after resting) to state of charge (SOC). The authors examine two common ways to build this curve. The Low‑Current (LC) method gently charges and discharges the cell with a very small current so that the measured voltage is close to its resting value. This procedure is simple but tends to smooth over sharp changes in the curve. The Incremental Current (IC) method, in contrast, uses short current pulses at many charge levels, separated by rest periods. This adds experimental effort but captures finer detail wherever voltage changes quickly with charge, which turns out to be crucial for precise estimation.
Connecting Curves to Smart Estimators
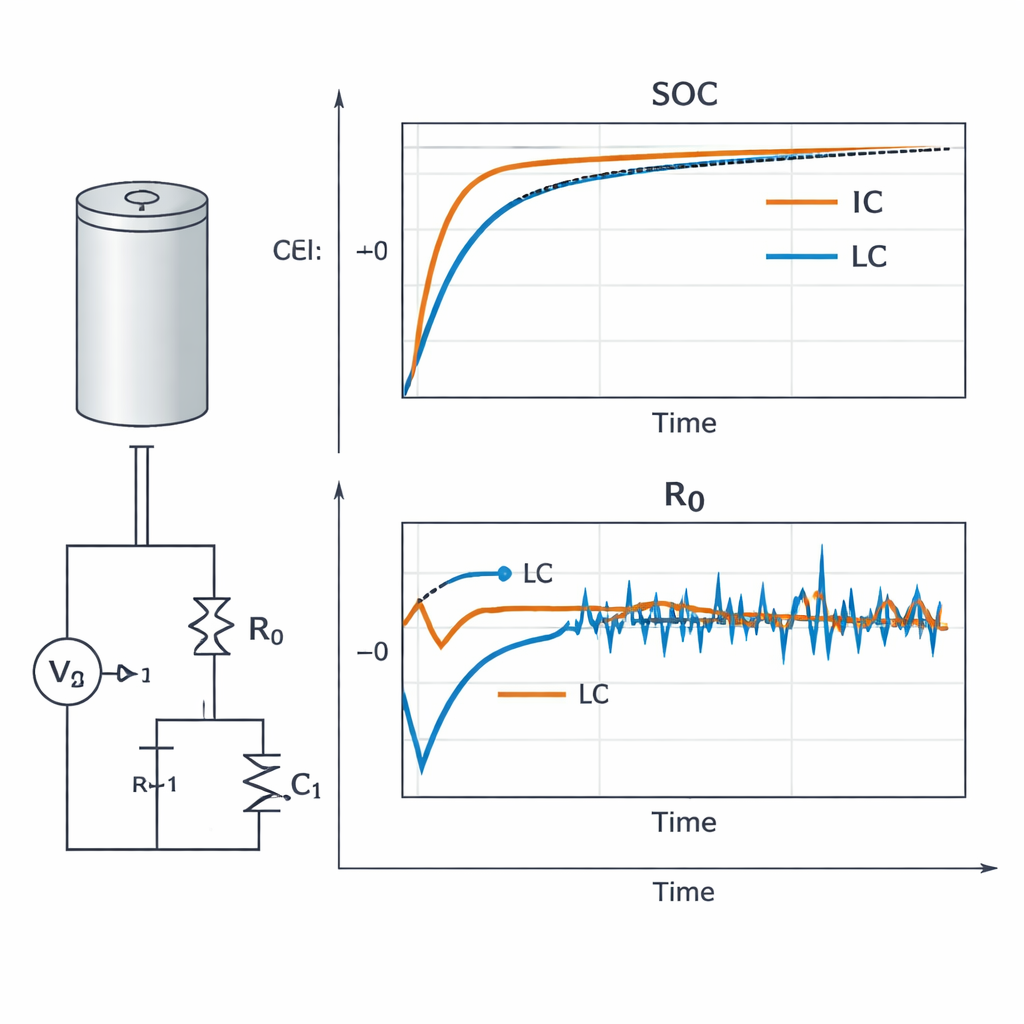
Modern battery management systems increasingly use advanced estimation algorithms, such as the Unscented Kalman Filter (UKF), to infer hidden quantities like SOC and State of Health (SOH) in real time. The authors combine these algorithms with a simple but widely used electrical “equivalent circuit” model of a cell: a voltage source that depends on SOC, a main series resistance, and a resistor–capacitor branch capturing transient effects. Into this model they plug either the LC‑based or IC‑based voltage–charge curves and then ask how well each version lets the UKF track SOC and the series resistance R0, which they use as a practical indicator of aging.
Testing Under Real Driving Conditions
Instead of relying only on gentle laboratory cycles, the study stresses the model with a highly dynamic car‑like driving profile known as FUDS. Current alternates rapidly between charging, discharging, and coasting, closely resembling city traffic. Using public datasets from NASA and the CALCE battery repository, the researchers first show that battery capacity and internal resistance change together over many cycles, supporting the idea that R0 is a useful health marker. They then let the UKF run with both voltage–charge curves, comparing its SOC estimates, predicted terminal voltage, and tracked R0 against a detailed reference model using standard error measures over the entire drive.
Faster, Cleaner Estimates with Finer Detail
The results clearly favor the more detailed IC method. When the UKF starts with some random uncertainty, the IC‑based curve yields lower average errors in SOC and better reconstruction of the battery’s voltage, while keeping the computational burden the same as the LC‑based version. When the authors deliberately give the filter a large initial mistake in SOC—starting it at 65% when the battery is actually at 80%—the contrast is stark: with the IC curve, the estimate snaps back to the right value within fewer than ten time steps; with the LC curve, it takes more than 200. This behavior traces back to a simple idea: where the voltage–charge curve has a steeper slope, small mismatches in voltage contain more information, so the filter can correct SOC more decisively.
Reading Battery Aging in Real Time
For health estimation, the UKF continuously reconstructs the internal resistance R0 from the measured current and voltage. The authors then smooth this signal with a moving average and examine its long‑term trend. With the LC‑based curve, the estimated resistance jumps and oscillates, especially under rapid current changes, even though the true physical resistance cannot be changing that fast. Such numerical noise could trigger false alarms in a real battery management system. With the IC‑based curve, R0 evolves much more smoothly and with a more realistic, gently rising trend, providing a cleaner picture of gradual aging without sacrificing responsiveness to genuine changes.
What This Means for Everyday Batteries
In plain terms, the study shows that a more informative voltage–charge map makes the brain of the battery management system smarter. Using the incremental‑current‑based curve allows the UKF to find the true charge level quickly, shrug off poor initial guesses, and track internal resistance in a stable way under real driving profiles. Because the extra effort lies mainly in the one‑time laboratory characterization rather than in on‑board computing, manufacturers can adopt the IC approach without making battery electronics more complex. The payoff is more reliable range estimates, safer operation, and better early warning of battery aging in electric vehicles and other energy‑storage devices.
Citation: Mikhak-Beyranvand, M., Salehi, M. & Mohammadkhani, M.A. Assessing the impact of open-circuit voltage estimation methods on UKF performance for lithium-ion battery SOC and SOH estimation. Sci Rep 16, 7605 (2026). https://doi.org/10.1038/s41598-026-38846-4
Keywords: lithium-ion batteries, state of charge estimation, battery health monitoring, Kalman filter, electric vehicle batteries