Clear Sky Science · en
Uncertainty analysis of physical-based carbon accounting in cotton T-shirt manufacturing
Why your T-shirt’s footprint matters
Most of us own a drawer full of cotton T-shirts, but few realise how much climate impact is stitched into each one. This study looks closely at the greenhouse gas emissions from making a single 150‑gram cotton T-shirt, from raw fiber entering the factory to the finished shirt leaving it. Instead of asking only “how big is the footprint?”, the researchers focus on a subtler but crucial question: “how sure are we about that number?” Their findings reveal where emissions really come from in T-shirt production and where the underlying data are most shaky, offering clues for making fashion both cleaner and more honestly measured.
Following a T-shirt from thread to hanger
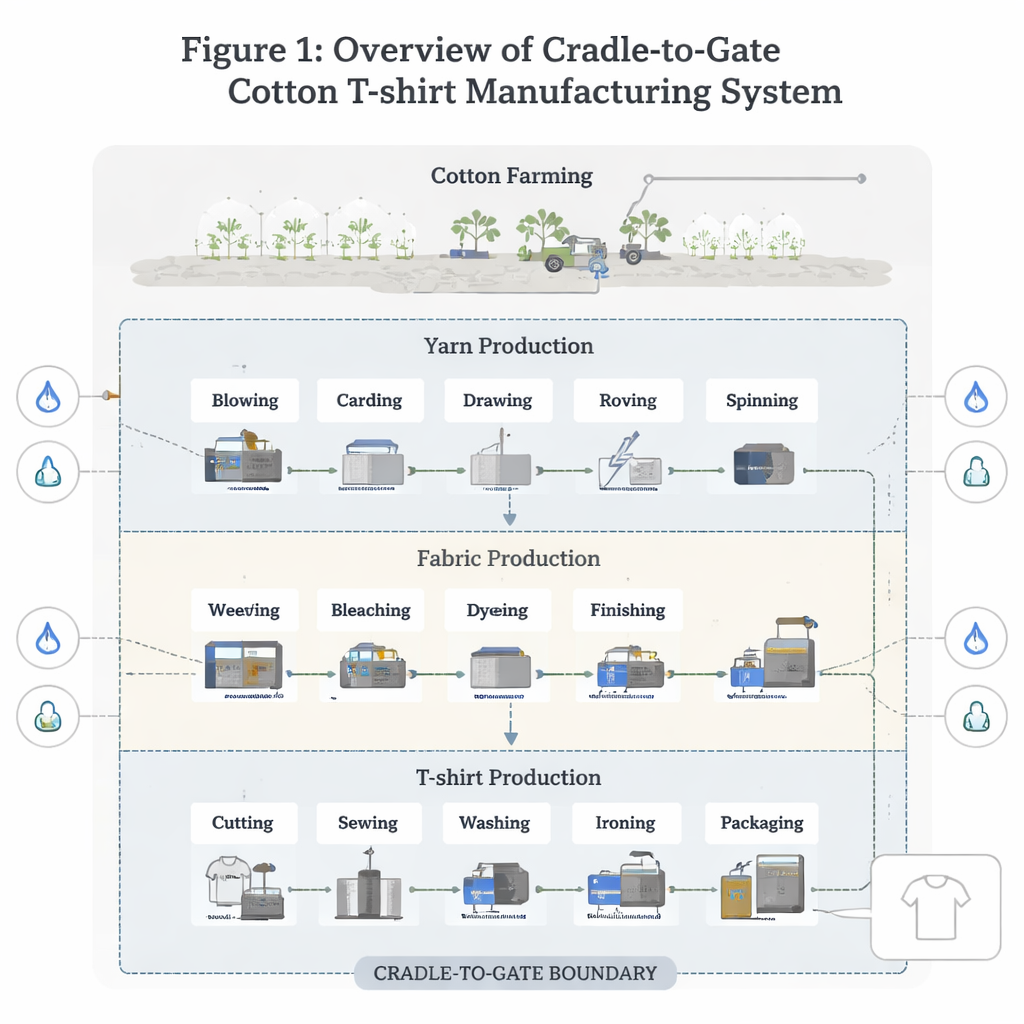
The authors examine the “cradle-to-gate” journey of a T-shirt: yarn production, fabric production and final shirt assembly. They deliberately stop at the factory gate, excluding cotton farming, transport, wearing, washing and disposal to keep the focus on what happens inside textile mills. Using a physical, process-based method, they calculate emissions from specific activities—such as kilowatt-hours of electricity used for spinning or dyeing—rather than from money spent. This allows them to track which machines and steps matter most for climate impact, and to compare different technological options, like ring-spun versus rotor-spun yarn, or woven versus knitted fabric.
How scientists put error bars on a carbon footprint
Carbon footprints are often reported as single numbers, but behind each sits a web of estimates and assumptions. To probe this, the team uses a tool called a pedigree matrix, which scores the quality of each data point along five simple dimensions: how precisely it was measured, how complete it is, how up to date it is, how well it matches the region, and how closely it reflects the actual technology in use. Each score is converted into an uncertainty range, and these ranges are combined mathematically to give an overall “error bar” for each process, each production stage and ultimately the whole T-shirt.
Where most of the emissions—and doubts—really lie
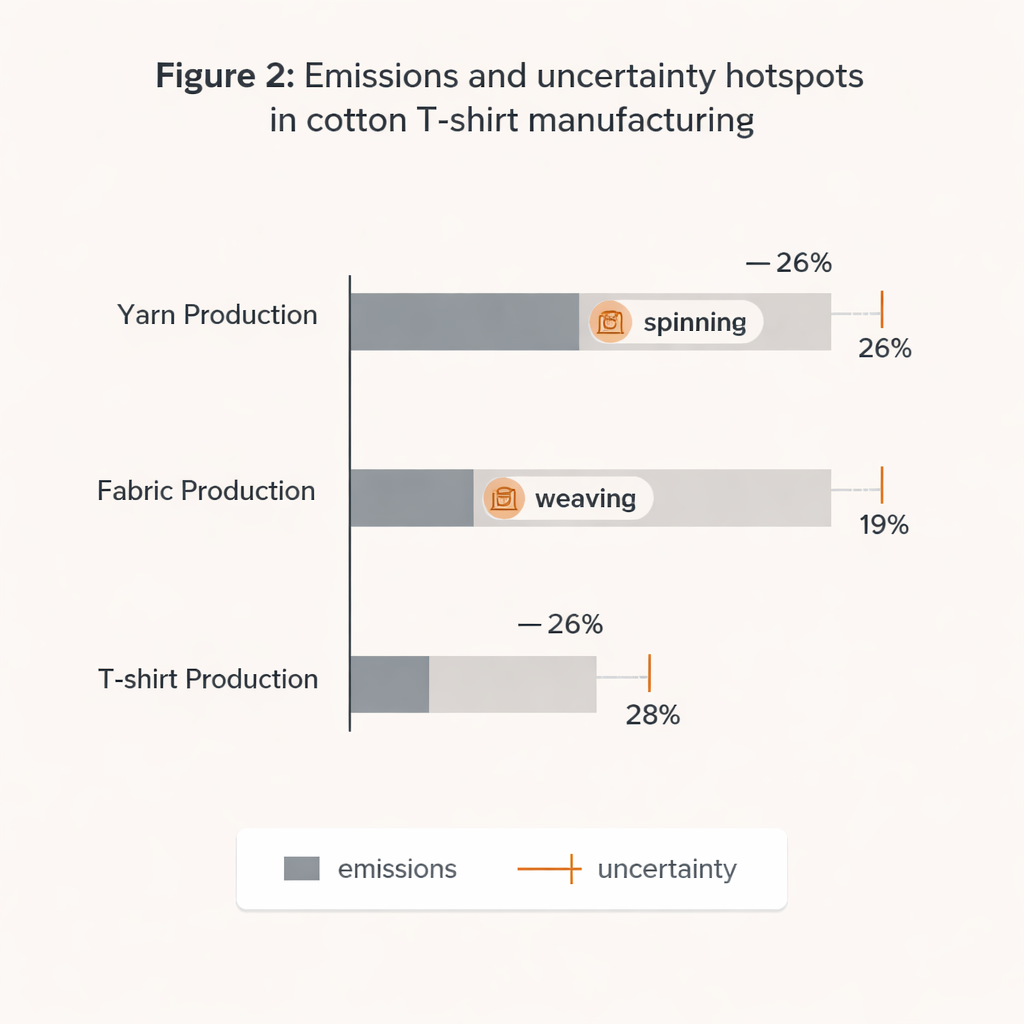
The study finds that making the fabric is the biggest climate burden inside the factory. Fabric production accounts for about 0.85 kilograms of CO2‑equivalent out of a total 1.37 kilograms per T-shirt, or nearly two‑thirds of the cradle‑to‑gate footprint. Within this stage, weaving, dyeing and a finishing step called sanforising dominate because they consume large amounts of electricity and heat. Yarn spinning is another major contributor, while earlier yarn steps such as blowing and carding add relatively little. Sewing and related shirt assembly tasks emit much less overall. When the uncertainty analysis is layered on top, the same energy‑hungry processes—especially weaving and spinning—also emerge as the main sources of doubt in the final numbers, because they rely heavily on generic datasets rather than factory‑specific measurements.
Understanding uncertainty without getting lost in jargon
Overall, the authors estimate the T-shirt’s cradle‑to‑gate footprint as 1.37 kilograms of CO2‑equivalent, plus or minus about 14 percent. That means the “true” value is likely somewhere between roughly 1.18 and 1.56 kilograms. Fabric production alone contributes about 69 percent of this overall uncertainty, yarn production about a quarter and T-shirt assembly only a small remainder. Interestingly, stages with the most emissions do not always have the highest relative uncertainty: fabric production is better documented than some other steps, so its percentage uncertainty is actually lower, even though small percentage swings there still translate into large absolute changes because its emissions are so big.
What this means for cleaner and clearer clothing
For non-specialists, the message is twofold. First, most of the climate impact of making a cotton T-shirt inside the factory comes from turning yarn into fabric, not from the final sewing line. Second, the carbon numbers that appear on labels or in sustainability reports are not exact; they carry built‑in uncertainty that is especially high for spinning and weaving. The authors argue that companies and policymakers should present carbon footprints as ranges rather than single figures and should prioritise better, on‑site data collection and more up‑to‑date emission factors for the most energy‑intensive processes. Doing so would not only sharpen our picture of fashion’s climate impact, but also make it easier to compare products fairly and to target investments where they will cut the most carbon per T-shirt.
Citation: Olugbemi, E., Bolson, N.F. Uncertainty analysis of physical-based carbon accounting in cotton T-shirt manufacturing. Sci Rep 16, 7586 (2026). https://doi.org/10.1038/s41598-026-38773-4
Keywords: cotton T-shirt, textile emissions, carbon accounting, life cycle assessment, data uncertainty