Clear Sky Science · en
MM-GradCAM: an improved multimodal GradCAM method with 1D and 2D ECG data for detection of cardiac arrhythmia
Why this heart study matters to you
Irregular heartbeats, known as arrhythmias, can lead to fainting, strokes, or sudden death, yet they often leave no warning signs until it is too late. Doctors rely on electrocardiograms (ECGs)—the familiar spiky lines tracing heart activity—to spot trouble. In recent years, computer programs have become very good at reading these traces, sometimes rivaling specialists. But they usually work like a sealed box: they give an answer without showing how they arrived there. This study introduces a new way to make these powerful tools more transparent, helping doctors see exactly what parts of a patient’s ECG guided the computer’s decision.
Looking inside the black box
Many modern medical AI systems use deep learning, a technique that automatically discovers patterns in data instead of relying on handcrafted rules. While this often boosts accuracy, it also hides the reasoning process, which is a serious concern when lives are at stake. To build trust, researchers have turned to “explainable AI” methods that highlight the regions of an image or signal that most influenced a model’s judgment. One of the most widely used tools for this is called Grad-CAM, which creates heat maps—color overlays showing where the algorithm was paying attention. Until now, however, these explanations were usually limited to just one type of input, such as a raw ECG signal or an image, but not both together.
Two views of the same heartbeat
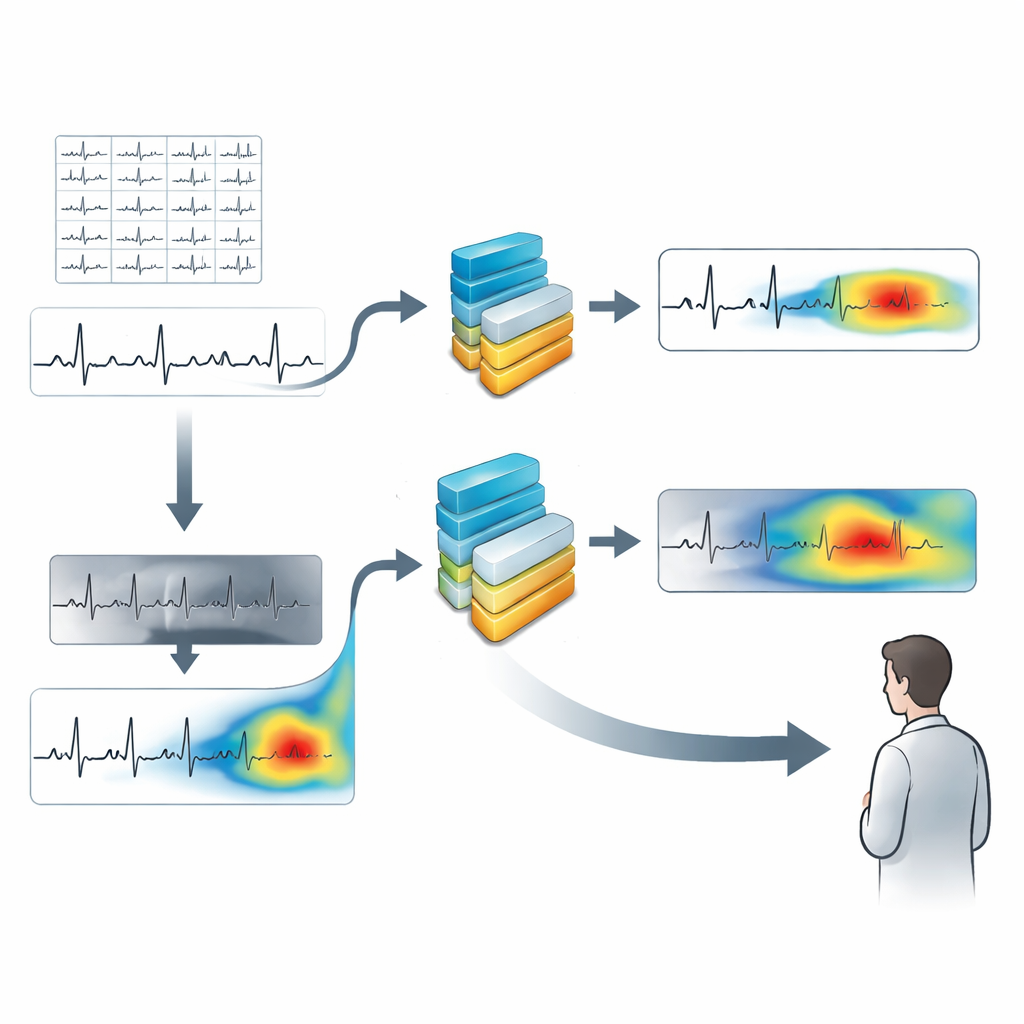
In this work, the authors focused on a single commonly used ECG channel, called Lead II, taken from a large public database of more than 10,000 patients. Each 10-second recording was handled in two different ways. First, it was kept in its original one-dimensional form, a simple line tracing voltage over time. Second, it was turned into a greyscale picture—essentially a plotted ECG strip saved as an image. For each form, the team built a matching deep-learning model based on a 17-layer convolutional neural network, a popular architecture for pattern recognition. One network learned from the 1D signal, the other from the 2D image, and both were trained to sort heartbeats into four rhythm groups: normal rhythm, slow rhythm, a rapid rhythm group, and atrial fibrillation–related rhythms.
Combining two explanations into one
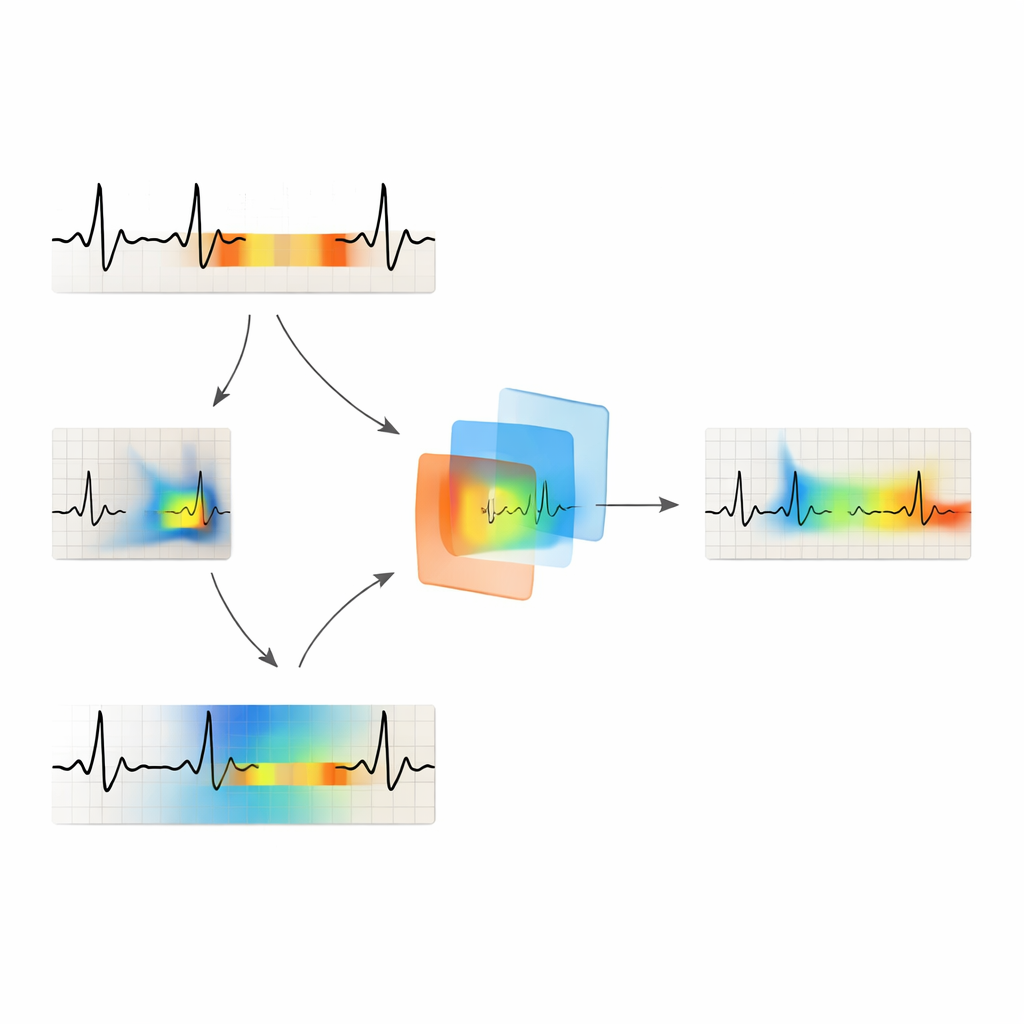
After training, the researchers applied Grad-CAM separately to the signal-based and image-based models. For the 1D model, they produced colored segments over the ECG line where the network was most focused. For the image model, they generated heat maps highlighting hot spots in the ECG picture. The new method, called MM-GradCAM (multi-modal Grad-CAM), then aligned these two views in time and space and fused them into a single explanation. This unified map shows, on one combined ECG strip, both the time-series clues and the image-based patterns that drove the AI’s decision. A cardiologist reviewed many examples, comparing the highlighted regions with known features of different rhythms, such as missing P waves in atrial fibrillation or very regular fast beats in certain rapid rhythms.
How well the system reads the heartbeat
On unseen test patients, the image-based model correctly classified rhythms about 97% of the time, while the signal-based model reached about 93% accuracy. Performance varied by rhythm type, with the image model generally doing better, especially for more complex or subtle patterns. At the same time, the fused MM-GradCAM maps showed that each view contributes something different. In some patients with atrial fibrillation, the signal-based explanation missed key regions, while the image-based map correctly focused on stretches where normal waveforms were absent. In other cases, such as certain rapid rhythms, the signal-based map gave a clearer and more clinically sensible picture. By presenting both together, MM-GradCAM exposed strengths and weaknesses that would be invisible if only one input form were used.
What this means for future heart care
The study’s main message is not just that a computer can spot abnormal heart rhythms accurately—many systems can already do that—but that its reasoning can now be made more understandable to human experts. By combining signal- and image-based explanations into one coherent view, MM-GradCAM gives cardiologists a way to check whether the AI is “looking” at medically meaningful parts of the ECG. This can improve trust, help spot errors, and even serve as a teaching tool for trainees learning to read complex rhythms. While the method still needs to be tested on more diverse patient groups and in real clinical workflows, it points toward a future in which powerful AI tools not only provide answers, but also clearly show their work.
Citation: Murat Duranay, F., Murat, E., Yıldırım, Ö. et al. MM-GradCAM: an improved multimodal GradCAM method with 1D and 2D ECG data for detection of cardiac arrhythmia. Sci Rep 16, 7919 (2026). https://doi.org/10.1038/s41598-026-38654-w
Keywords: cardiac arrhythmia, electrocardiogram, deep learning, explainable AI, Grad-CAM