Clear Sky Science · en
Fractal analysis of hepatocellular carcinoma vasculature shows regional differences independent of vascular invasion
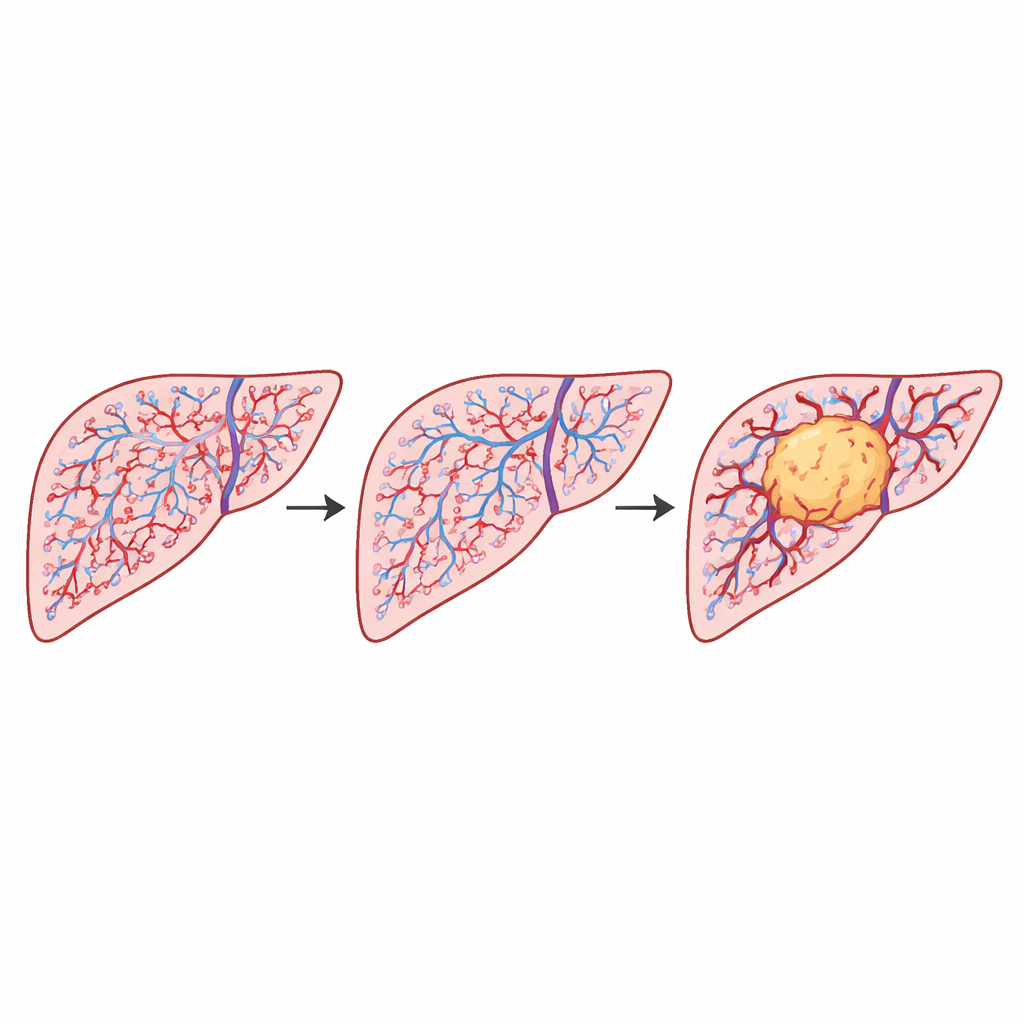
Seeing Cancer Through Its Blood Vessels
Doctors know that cancers grow their own chaotic network of blood vessels, and that the way these vessels are arranged can influence how well treatments work. In liver cancer, drugs that target blood supply are already part of standard care, but current lab measures mostly count how many vessels there are, not how they are laid out. This study asks a simple but powerful question: can we capture the “pattern” of tumor blood vessels with just a few numbers, and do these patterns differ between tumor, nearby tissue, and the rest of the liver?
Patterns Hidden in Branching Networks
The researchers focused on hepatocellular carcinoma, the most common primary liver cancer. They examined tissue samples from 29 patients whose liver specimens had been stained so that the inner lining of blood vessels appeared brown under the microscope. Instead of just counting vessels, they analyzed how the vessels collectively filled space, using mathematical tools often applied to complex natural shapes like coastlines or tree branches. Two key measures were used: one that describes how “intricate” the vessel network is, and another that describes how the empty spaces between vessels are distributed. Together, these numbers condense the visual complexity of the vascular network into a form that can be compared across different regions of the liver.
Turning Microscope Images into Measurable Maps
To do this, the team first had to reliably separate vessels from background tissue on large digital slides. They built an automated image-processing pipeline that identified the brown-stained vessels, cleaned away noise, and filled in vessel interiors, producing clear black-and-white maps of vessel networks. These automatic segmentations were checked against a liver pathology expert and found to agree well, especially in ways that mattered for the global measures of vessel organization. The slides were then cut into many smaller tiles, each assigned to one of three regions: tumor, tissue immediately surrounding the tumor (peri-tumoral), or distant non-tumoral liver. Tiles containing dead (necrotic) tissue or major artifacts were carefully excluded, because they can mimic dense, unrealistic vessel patterns.
How Tumor Regions Differ from the Rest
Across thousands of tiles, the study found clear, statistically strong differences in vascular patterns between the three regions of the liver. Non-tumoral liver tissue showed the highest complexity, behaving almost like a space-filling web at larger scales. Peri-tumoral tissue sat in the middle, while tumor regions had consistently lower complexity. A related measure of how empty spaces between vessels are arranged also increased from non-tumoral to peri-tumoral to tumor tissue, indicating that tumor-associated vessels are more clustered and more spatially correlated. Crucially, whether or not the tumor had begun invading nearby blood vessels—a key clinical warning sign—did not measurably change these overall patterns. The architecture of the vessel network was shaped mainly by the presence of the tumor itself, not by this invasion step.
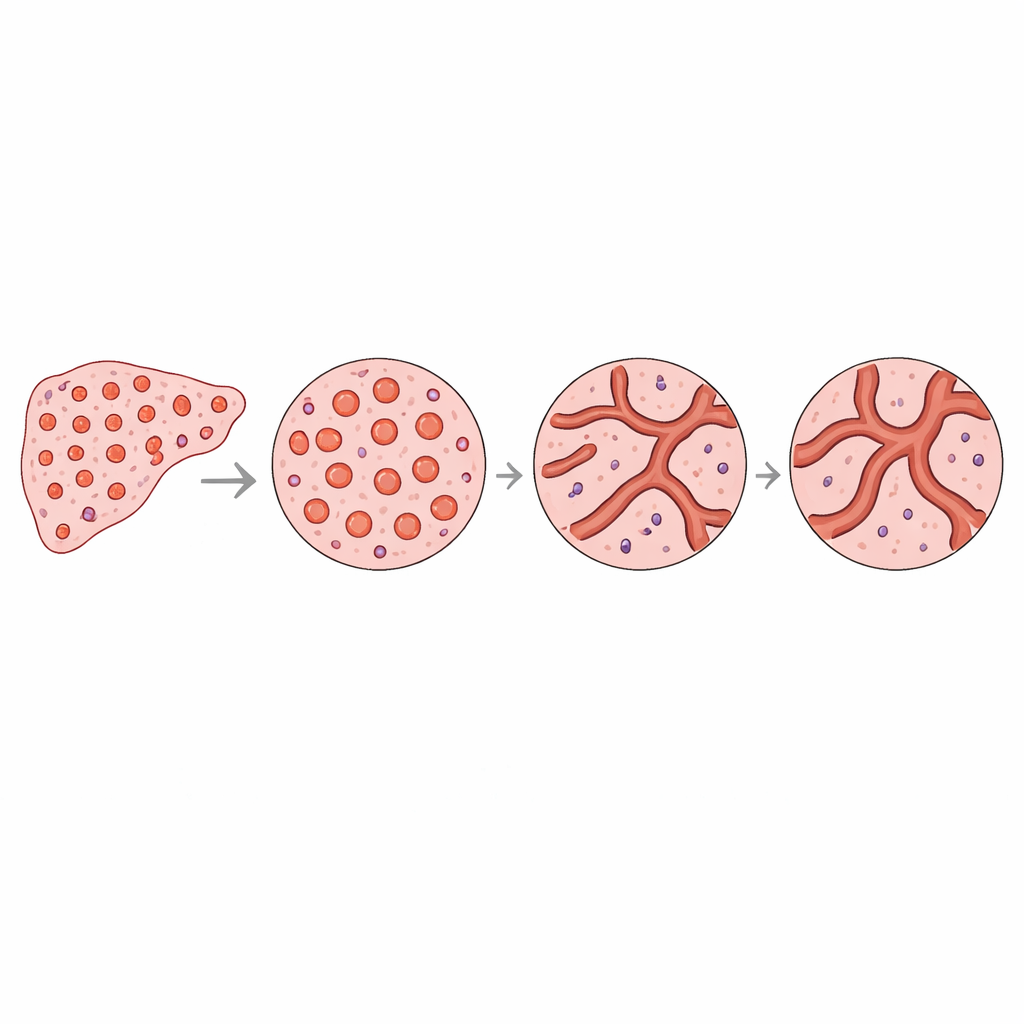
Why Shape and Size of Vessels Matter
To understand what lay behind these numerical differences, the authors looked more closely at the shapes and sizes of individual vessels. In healthy liver, there was a pronounced build-up of many small, round vessels, with a few larger ones. In tumor regions, the total vessel area was similar, but vessels were more evenly spread across sizes and more often elongated or irregular. Simple models showed that a network rich in many tiny, round vessels forces more small boxes to be used when “covering” the pattern, which raises its complexity measure. By contrast, a network with fewer small vessels and more uniform sizes appears less intricate, even if it contains about the same total vessel area. This geometric shift matches the observed drop in complexity within tumors and explains how subtle changes in vessel shape distributions can reshape the overall vascular pattern.
What This Could Mean for Future Scans
For non-specialists, the main takeaway is that liver tumors do not just grow more blood vessels; they reorganize them in a distinct, measurable way that spreads into the surrounding tissue. These differences can be captured by compact mathematical descriptors that summarize how vessels and the spaces between them are arranged. The work suggests that, in the future, advanced imaging methods might estimate these descriptors without a biopsy, providing new, non-invasive biomarkers of how far a tumor’s influence extends and how its blood supply is structured. At the same time, the study shows that microscopic invasion of nearby vessels does not necessarily leave a recognizable fingerprint on the large-scale vessel pattern, underlining that not all dangerous tumor behaviors are visible through vascular architecture alone.
Citation: Penney, J., Nardon, V., Beaufrere, A. et al. Fractal analysis of hepatocellular carcinoma vasculature shows regional differences independent of vascular invasion. Sci Rep 16, 11049 (2026). https://doi.org/10.1038/s41598-026-38580-x
Keywords: liver cancer vasculature, fractal vessel architecture, hepatocellular carcinoma, tumor microenvironment, noninvasive imaging biomarkers