Clear Sky Science · en
Comparison of TyG indices and atherogenic index of plasma with hypertension in the PERSIAN Guilan cohort
Why blood tests can reveal hidden pressure risks
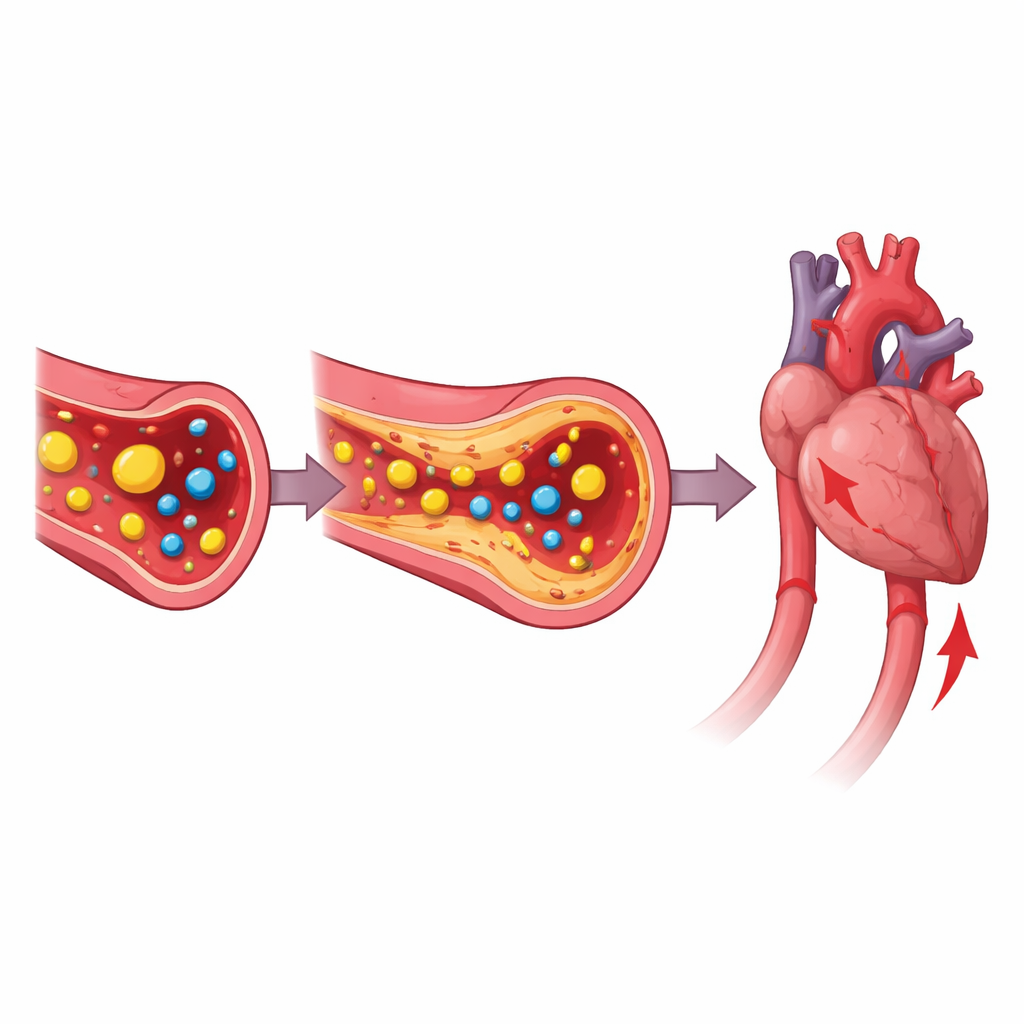
High blood pressure is one of the world’s leading causes of heart attacks, strokes, and kidney disease, yet many people feel perfectly fine until serious damage is already underway. Doctors know that problems with blood sugar and blood fats often travel together with rising blood pressure, but direct tests for these underlying problems can be expensive and complicated. This study asked a practical question: could simple calculations based on routine blood tests and body measurements help flag who is most likely to have high blood pressure, even before more obvious disease appears?
Simple numbers hiding in everyday checkups
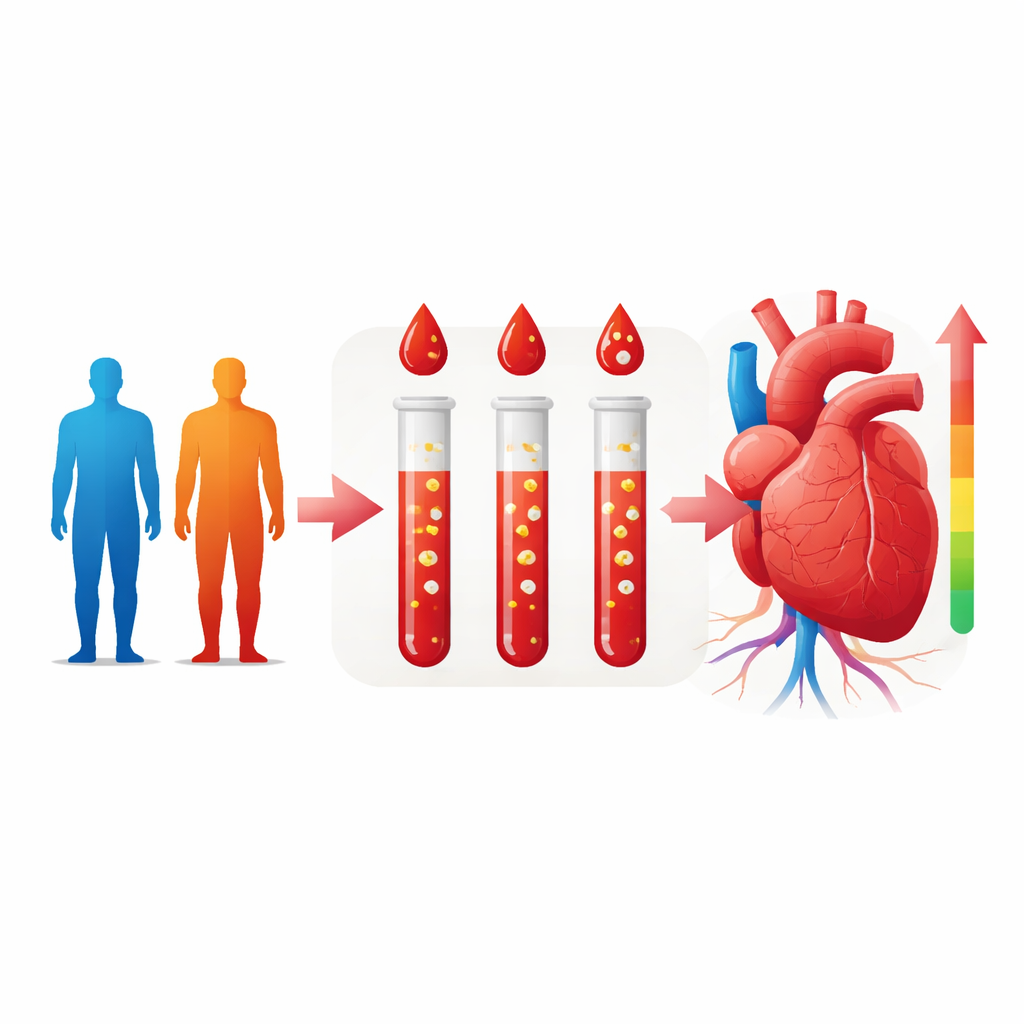
The researchers focused on two families of measurements that can be derived from standard lab results. The first involves the “triglyceride–glucose” (TyG) index, which combines fasting blood sugar and blood fat levels into a single marker of how hard the body is working to handle energy. By multiplying this index by common body measurements such as body mass index, waist size, waist‑to‑height ratio, or waist‑to‑hip ratio, they created several related scores that reflect both internal chemistry and body shape. The second key measure, called the atherogenic index of plasma (AIP), captures the balance between harmful fats that promote clogged arteries and protective fats that help clear them. All of these numbers can be calculated from a typical fasting blood draw plus a tape measure.
A large community snapshot from northern Iran
To see how well these indices track with blood pressure, the team analyzed data from more than 10,500 adults aged 35 to 70 years who took part in the PERSIAN Guilan Cohort Study in northern Iran. Participants came from both cities and villages and had detailed interviews, physical exams, and laboratory testing. The scientists separated people into three groups based on blood sugar levels: normal, prediabetes, and diabetes. High blood pressure was defined using standard cutoffs or current use of blood pressure medication. Statistical models then examined how much the odds of having high blood pressure rose with each step up in the various indices, while accounting for age, sex, smoking, physical activity, and other lifestyle factors.
Different markers matter for different sugar levels
Across the entire group, every index studied was linked to a higher chance of having high blood pressure. The strongest overall signal came from AIP, followed by the TyG index combined with waist‑to‑height ratio and with waist‑to‑hip ratio. When the researchers looked more closely at blood sugar groups, they saw an important pattern. Among people with normal blood sugar, AIP again stood out as the best‑linked marker, with TyG based on waist‑to‑height ratio close behind. In people with prediabetes, however, the TyG index tied to waist‑to‑hip ratio showed the tightest connection to high blood pressure, suggesting that where fat is stored on the body becomes especially important in this in‑between state. For participants with diabetes, AIP once more showed the strongest association, with TyG combined with waist‑to‑height ratio also performing well.
How well these signals separate higher‑risk people
The team also tested how accurately each index could distinguish between people with and without high blood pressure. Here, the TyG‑based scores that include waist measures did slightly better than the others, while AIP, despite its strong statistical link, was less powerful at separating the two groups on its own. None of the indices were perfect crystal balls; rather, they provided modest but meaningful extra information beyond traditional risk factors. Still, because they are cheap, easy to compute, and available from routine health checkups, they offer promising tools for large‑scale screening, especially in regions where advanced testing is not readily accessible.
What this means for everyday health
For lay readers, the takeaway is that common blood tests and a simple tape measure can do more than just check boxes on a lab report. By combining sugar, fat, and body shape into a handful of calculated scores, doctors can gain early clues about who may already be on the path toward dangerous blood pressure levels, even if they have not yet been diagnosed with diabetes or heart disease. This study suggests that different scores may matter more at different stages of metabolic health: one pattern of numbers is most informative in prediabetes, while another better flags risk when blood sugar is still normal or clearly in the diabetic range. Using the most appropriate index for each person’s metabolic profile could help clinicians spot trouble sooner and tailor prevention efforts—through lifestyle changes or closer monitoring—before high blood pressure leads to more serious illness.
Citation: Amini-Salehi, E., Joukar, F., Letafatkar, N. et al. Comparison of TyG indices and atherogenic index of plasma with hypertension in the PERSIAN Guilan cohort. Sci Rep 16, 8095 (2026). https://doi.org/10.1038/s41598-026-38568-7
Keywords: hypertension, insulin resistance, blood lipids, prediabetes, cardiometabolic risk