Clear Sky Science · en
Integrated approaches to explore temporal-spatial changes in gene reassortment of highly pathogenic avian influenza A(H5) virus in Eurasia, 2000–2023
Why bird flu’s genetic “remix zones” matter to us
Bird flu is no longer just a problem for chickens and ducks on distant farms. A highly dangerous form of avian influenza, known as H5, has been spreading across Europe and Asia for more than two decades, killing wild birds, wiping out poultry flocks and occasionally infecting mammals, including cows and humans. This study asks a simple but urgent question: where and under what conditions is the virus most likely to “remix” its genes and produce new, potentially more dangerous strains—and how can we spot those danger zones in advance?
Following a shape‑shifting virus
Influenza viruses carry their genetic material in eight separate pieces, which can be swapped when two different strains infect the same bird. This process, called reassortment, can create entirely new virus combinations. The researchers gathered more than 300,000 influenza gene sequences from global databases and, using a standardized pipeline, grouped them into genetic families for each of the eight segments. They then defined 136 distinct genetic “genotypes” of highly pathogenic H5 viruses circulating worldwide between 1996 and 2023. By tracking where and when these genotypes appeared, they could reconstruct the changing landscape of H5 viruses over time.
Three waves of viral change
The team found that the evolution of H5 across Eurasia unfolded in three broad waves. From 2000 to 2013, one main genotype dominated outbreaks, mostly in Asia and parts of Africa, producing sporadic but severe events in poultry farms. Around 2014, a new branch of H5, known as clade 2.3.4.4, emerged and ushered in a second wave. During 2014–2021, many different genotypes coexisted and spread through both wild birds and domestic flocks, especially in Europe, Asia and later the Americas. A third wave began around 2021 with the rise of clade 2.3.4.4b H5N1, which became entrenched in several regions and caused year‑round outbreaks—an “endemic” pattern rather than occasional winter surges. 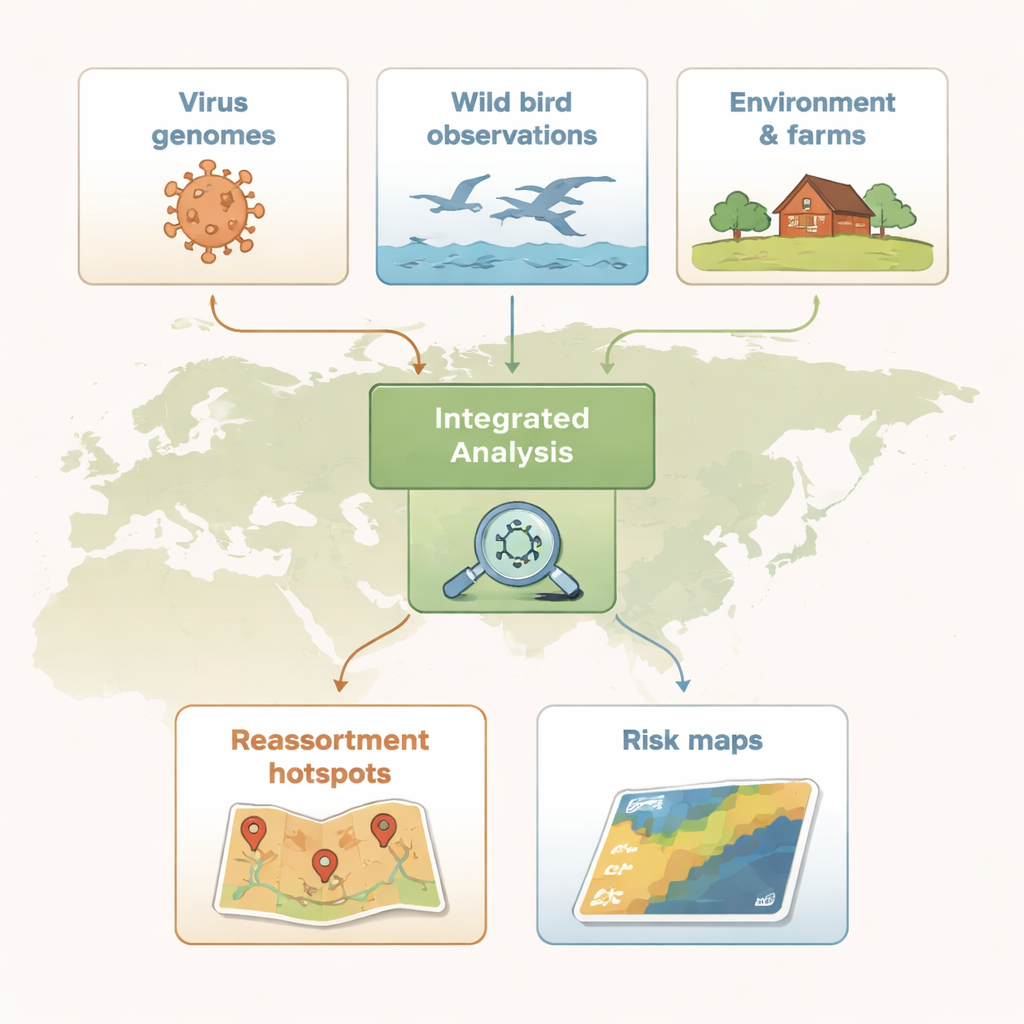
Mapping hidden hotspots
To pinpoint where gene swapping was most intense, the scientists divided Eurasia into 100‑kilometer grid squares and counted how many different H5 genotypes were detected in each one. Using a spatial statistic that highlights clusters, they identified reassortment hotspots—areas where many genotypes occurred together more often than expected. Early on, these hotspots were concentrated in Southeast Asia. In the second wave, they shifted north and west, appearing along the Pacific coasts of East Asia and across Central and Western Europe, including regions of Denmark, southern Sweden and northern Italy. These patterns suggested that both geography and farming practices were steering the virus’s evolution.
Bird communities, farms and the environment
Hotspots do not arise from a single “bad” bird species or one type of farm; they develop where many factors overlap. The team combined citizen‑science bird sightings from the eBird project with land‑cover maps, poultry density data, and records of H5 outbreaks in farms. They first identified wild bird species that tended to be present in hotspot grids, focusing on three major bird orders: waterfowl such as ducks and geese (Anseriformes), shorebirds (Charadriiformes), and songbirds (Passeriformes). Surprisingly, many high‑risk species had never been formally tested for bird flu. To capture the combined effect of multiple species, the authors built a “polyspecies risk score” that summarized how likely a location’s bird community was to support reassortment. They then added information on chicken and duck densities, farm outbreaks, and land types such as cropland or built‑up areas to estimate which combinations of conditions most strongly predicted hotspots.
From wetlands to chicken sheds
The analysis revealed a shift in the virus’s ecological niche. In the early years, reassortment was linked mainly to duck farming, consistent with ducks acting as a quiet reservoir that carries the virus without obvious illness. Over time, as highly pathogenic H5 viruses became entrenched on chicken farms—helped in some regions by long‑term circulation and vaccination practices—the strongest signals moved toward chicken‑dense areas and mixed farming landscapes. Built‑up areas in parts of Asia and croplands in Europe also correlated with hotspots, likely reflecting where people, farms and wild birds intersect. At the same time, non‑waterfowl birds such as passerines, which live in huge numbers around fields, suburbs and barns, increasingly appeared to bridge the gap between wild habitats and poultry sheds. 
What this means for preparedness
For non‑specialists, the essential message is that dangerous new forms of H5 bird flu are most likely to arise where dense poultry farming, diverse wild bird communities and human‑altered landscapes meet. By merging genetic data, bird‑watching records and environmental information into unified risk maps, this study offers a guide to where surveillance can be most effective—whether that means testing under‑studied bird groups, tightening biosecurity around high‑risk farms, or monitoring regions where the virus has become endemic. Understanding and watching these genetic “remix zones” is a practical step toward reducing the chance that an animal virus will surprise us with yet another leap in range, virulence or host species.
Citation: Chen, BJ., Liang, CC., Li, YT. et al. Integrated approaches to explore temporal-spatial changes in gene reassortment of highly pathogenic avian influenza A(H5) virus in Eurasia, 2000–2023. Sci Rep 16, 7518 (2026). https://doi.org/10.1038/s41598-026-38466-y
Keywords: avian influenza, H5N1, wild birds, poultry farming, viral evolution