Clear Sky Science · en
Particulate matter (PM2.5 and PM10) prediction using fourier series decomposition in combination with LSTM and SVM
Why cleaner air forecasts matter to everyone
Fine dust in the air is an invisible threat that we breathe every day. Tiny particles called PM2.5 and PM10 can slip deep into our lungs and bloodstream, raising the risk of heart and lung disease. Yet pollution levels can change sharply from hour to hour. This study explores how to forecast those ups and downs more accurately, hour by hour and season by season, in a busy Moroccan port city—so that authorities can warn residents and plan actions before the air turns dangerous.
Understanding dust in the city air
The researchers focused on Mohammedia, an Atlantic coast city that hosts an oil refinery and industrial areas, making it a useful test bed for air quality science. They examined two common types of particulate matter: PM2.5, the finer dust with diameters of 2.5 micrometers or less, and PM10, slightly larger particles up to 10 micrometers. Both stay suspended in the air and are known to be among the most harmful pollutants for human health. The team gathered hourly measurements of these particles from December 2020 to November 2021, creating a detailed record of how pollution rose and fell over days, weeks, and seasons.
Cleaning up messy real-world data
Like most real monitoring systems, the city’s instruments did not deliver perfect data. Some hours were missing because of sensor failures or communication glitches, and the distributions showed occasional extreme spikes. Instead of simply filling gaps with straight-line guesses that could blur real pollution peaks, the authors used a season-aware method. They first captured regular daily patterns—such as higher levels during busy traffic hours—then filled in only the remaining irregular part of the signal using local smoothing. They also separated out repeated patterns over multiple time scales (day, week, year) and used an anomaly-detection technique to flag and correct suspicious outliers. This careful cleaning aimed to keep genuine pollution events while removing noise.
Letting math and machines share the work
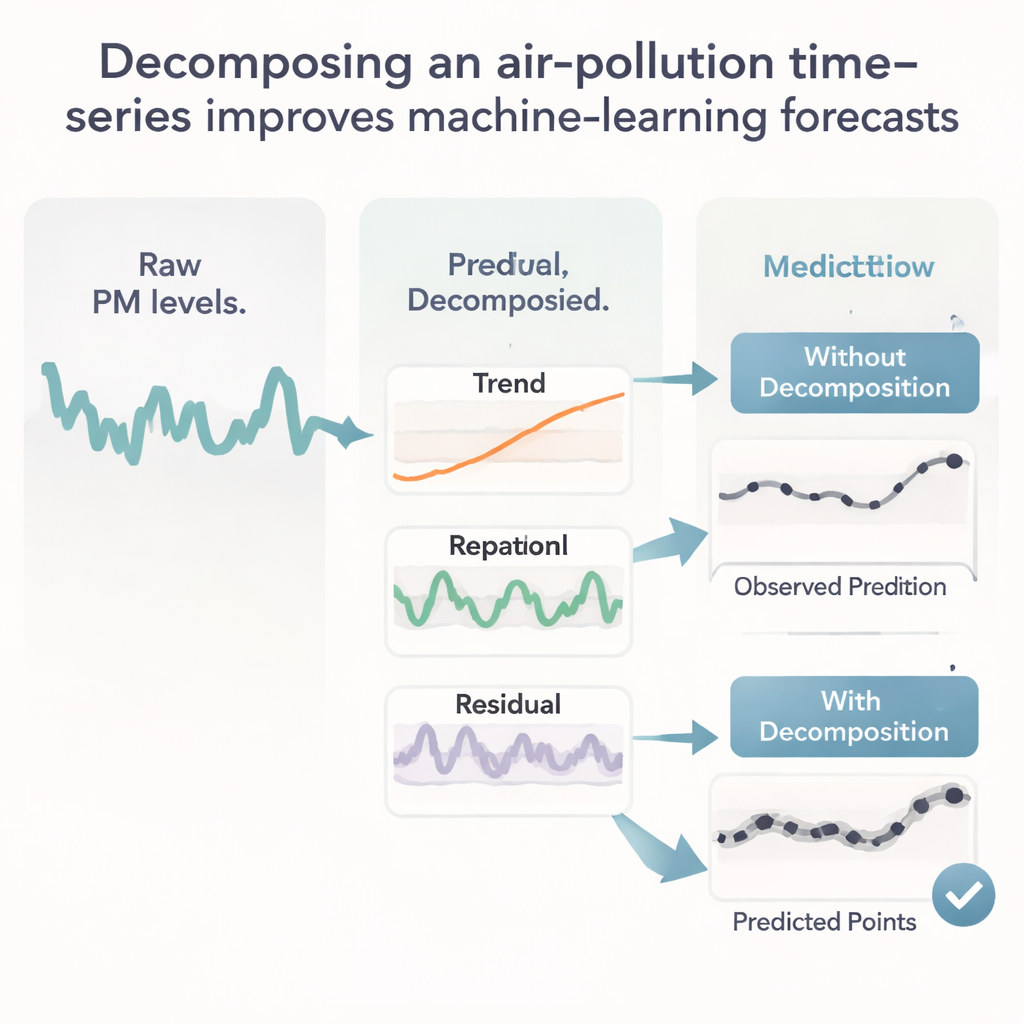
At the heart of the study is a marriage between classical mathematics and modern artificial intelligence. The authors used Fourier series, a tool that breaks a complicated curve into a sum of simple waves, to decompose the pollution time series into trend, seasonal cycles, and leftover fluctuations. They then trained two popular machine-learning models on these processed signals: support vector machines (SVM), which find patterns in data through flexible curves, and long short-term memory networks (LSTM), a type of neural network designed to learn from sequences over time. Versions of each model with Fourier-based preprocessing (SVMF and LSTMF) were compared to versions trained on raw data alone.
What the seasonal patterns reveal
The hourly records revealed distinct seasonal rhythms in Mohammedia’s air. For PM2.5, autumn showed the highest average levels, with long evening and night-time peaks stretching from about 7 p.m. to 2 a.m., likely tied to traffic, commerce, and social activities. Winter and summer also showed strong evening and late-night peaks, while spring exhibited two main bumps: one early afternoon and another in the evening. PM10 followed broadly similar patterns, with pronounced evening peaks and somewhat lower daytime levels in most seasons. These patterns underline that the worst air often coincides with periods when many people are outdoors or commuting.
Sharper forecasts with decomposed signals
Across all four seasons and both pollutants, the hybrid models that combined Fourier decomposition with machine learning clearly outperformed models trained on raw data. The LSTMF model, which couples LSTM with Fourier-based preprocessing, was consistently the best. For hourly forecasting, its accuracy ranked highest in every season, with especially strong results in autumn. When the team extended the horizon to predict seven days ahead, LSTMF still delivered high skill, with coefficients of determination (R²) close to or above 0.9 in many cases. In simple terms, decomposing the signal helped the models focus on meaningful structure—long-term trends and recurring cycles—while better handling short-term noise.
What this means for everyday life
For non-specialists, the key message is that smarter forecasting can turn raw sensor data into practical protection. By predicting hourly PM2.5 and PM10 levels more accurately, city planners and health agencies can anticipate when pollution will spike and warn residents with breathing problems, adjust traffic flows, or time industrial restrictions. Although this study looked at just one Moroccan city and used only past particle measurements (without adding weather or emission data), it shows that combining deep learning with mathematical decomposition is a powerful recipe for cleaner, more reliable air quality forecasts. With further refinement and expansion to more locations, such tools could underpin early-warning systems that help people breathe a bit easier in their daily lives.
Citation: Bennis, M., Youssfi, M., Morabet, R.E. et al. Particulate matter (PM2.5 and PM10) prediction using fourier series decomposition in combination with LSTM and SVM. Sci Rep 16, 7665 (2026). https://doi.org/10.1038/s41598-026-38436-4
Keywords: air pollution forecasting, particulate matter, machine learning, Fourier decomposition, urban air quality