Clear Sky Science · en
Flood susceptibility assessment using three machine learning techniques and comparison of their performance
Why Flood Risk in One Ethiopian Watershed Matters
Floods kill thousands of people worldwide every year, wipe out crops, and damage homes and roads. In Ethiopia’s Choke Watershed, a highland region that feeds the Blue Nile, flash floods arrive quickly and often without warning. This study shows how modern computer techniques can turn satellite images, maps, and rainfall records into detailed flood-risk maps, helping communities and planners decide where to build, where to farm, and where to protect people before the next storm hits.
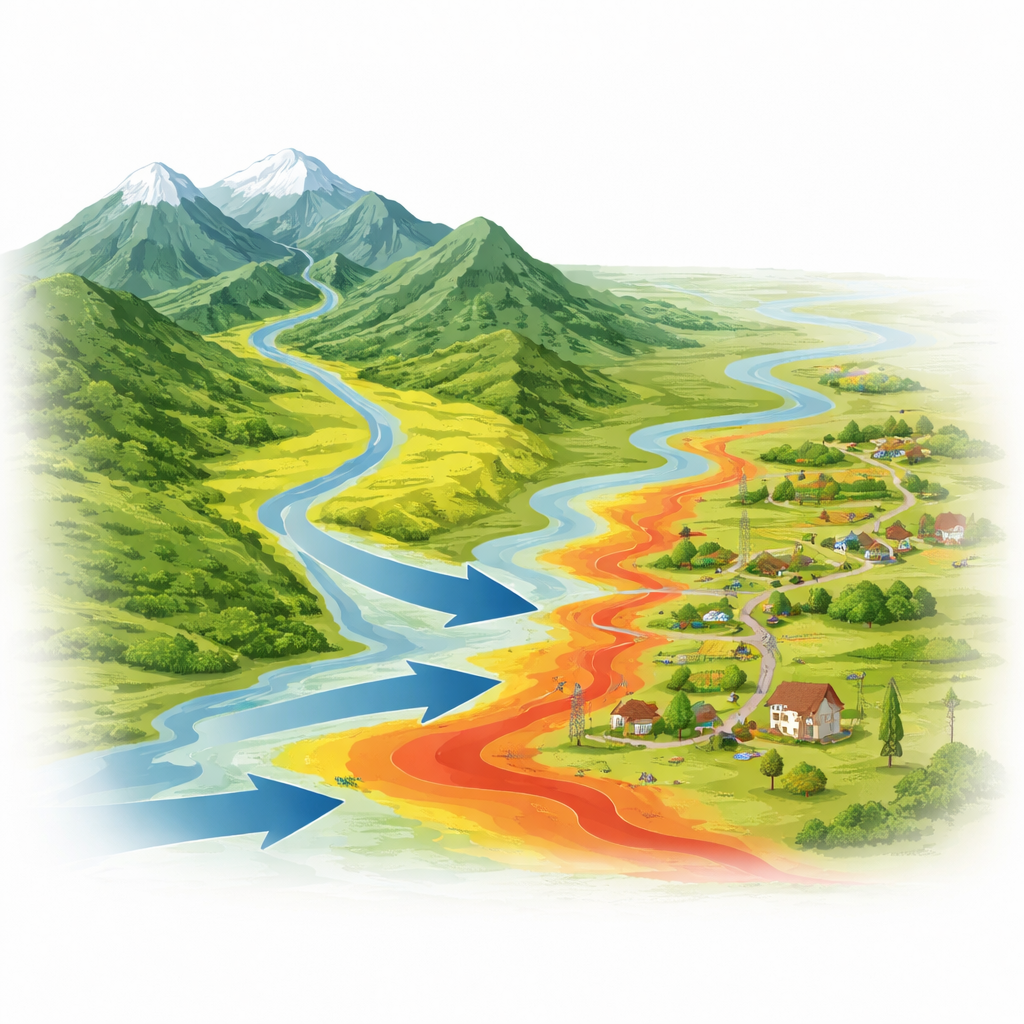
A Mountain Landscape Under Pressure
The Choke Watershed sits in the highlands of northwestern Ethiopia, where steep mountains give rise to more than 60 rivers and hundreds of springs. This rugged terrain supports farms, hydropower, drinking water, and even tourism, but it also funnels heavy seasonal rains into narrow valleys and floodplains. Over the past decade, repeated floods have damaged fields, roads, bridges, schools, and homes, especially during the main rainy season from June to September. Population growth, deforestation, and expanding towns have altered the land surface, often making it less able to absorb water and more likely to pass sudden surges of runoff downstream.
Turning Maps and Measurements into a Flood History
To understand where floods strike most often, the researchers first built a flood “inventory” for the watershed. They combined government disaster reports, field information, and radar images from Sentinel-1 satellites, which can see flooded areas even through clouds. For five major flood years between 2005 and 2020, they compared images taken before and after events to locate inundated zones. They also used elevation data to remove permanent lakes and steep slopes that would not host standing floodwater. From this, they assembled a balanced set of locations that had flooded and others that had remained dry, forming the learning material for their computer models.
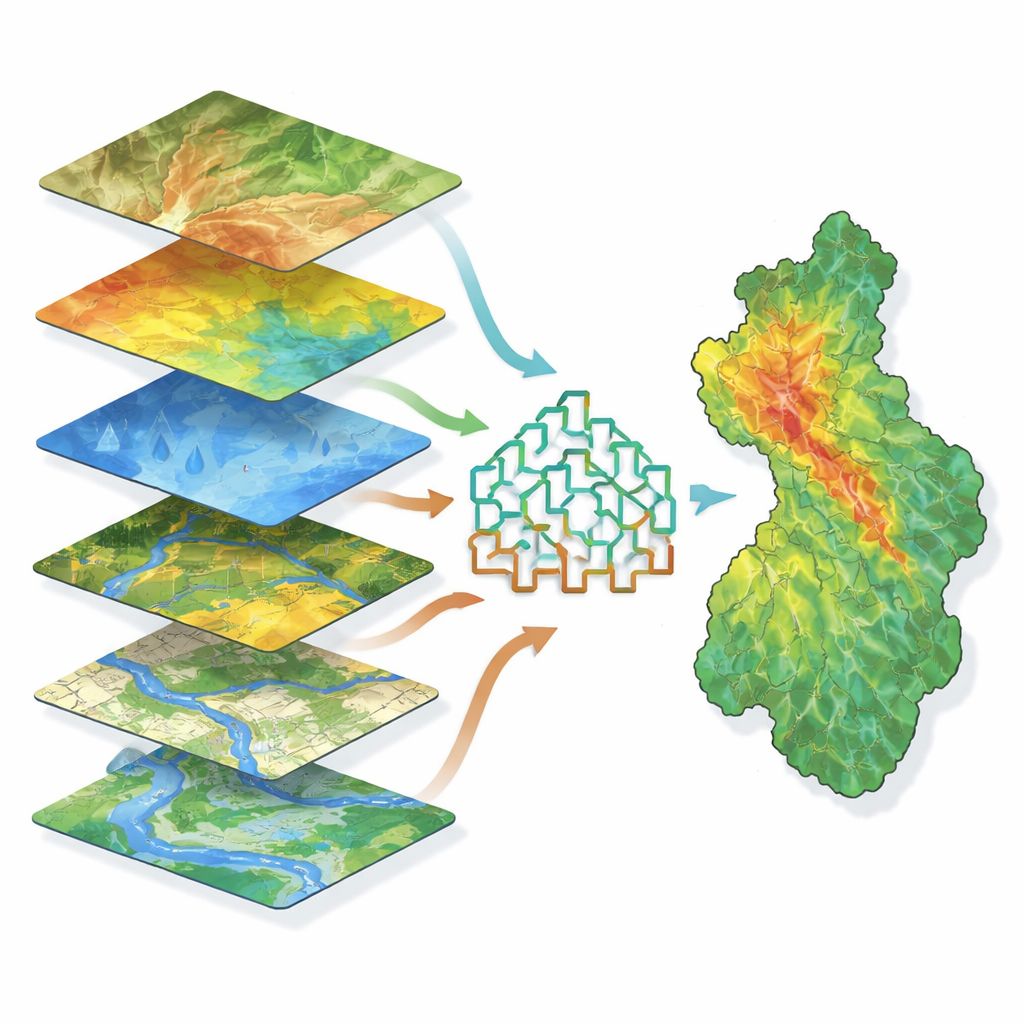
Reading the Land to Predict Future Floods
Next, the team gathered eleven types of information that influence where water accumulates, including terrain height, slope steepness, the way hillsides curve, soil moisture tendencies, river networks, distance to channels, rainfall, soil type, and land use. All of these were processed into matching map layers in a geographic information system. The models were trained to spot patterns linking these layers to past floods. Across different tests, three features stood out as especially important: elevation, slope, and a wetness index that reflects how easily water pools in certain spots. Low-lying areas with gentle slopes and high wetness values emerged as clear hot spots for flooding, while aspect (which direction a slope faces) and even rainfall variation mattered less in this particular mountainous setting.
Teaching Machines to Spot High-Risk Zones
The study compared three advanced machine learning methods that all rely on many decision trees working together: Random Forest, Gradient Boosting, and Extreme Gradient Boosting. These approaches are good at handling tangled relationships among many factors without needing perfect data or simple formulas. After splitting their data into training and testing groups, the authors tuned each model and checked performance using several statistical scores. Two of the methods, Gradient Boosting and Extreme Gradient Boosting, were especially accurate, correctly distinguishing flooded from non-flooded points about 97 percent of the time; Random Forest followed closely behind. All three produced flood susceptibility maps that divided the watershed into five classes from very low to very high risk, with the northern and southwestern sections showing the greatest danger.
From Computer Maps to Safer Communities
For non-specialists, the key outcome is that these machine-driven maps turn scattered records and satellite images into a clear picture of where floodwaters are most likely to spread. Only a modest fraction of the Choke Watershed falls into the highest-risk zones, but these pockets coincide with populated lowlands and important farmland. Local authorities can use the results to guide where to place new housing, strengthen bridges and drainage, or restore vegetation to slow runoff. While the models cannot replace detailed hydraulic simulations, they offer a fast, cost-effective way to focus limited resources in the most vulnerable areas and could be adapted to other hazards such as landslides or earthquakes. In a country where data and budgets are often scarce, this blend of satellites and smart algorithms offers a practical path toward more resilient landscapes and communities.
Citation: Asrade, T., Abebe, S., Tadesse, K. et al. Flood susceptibility assessment using three machine learning techniques and comparison of their performance. Sci Rep 16, 8099 (2026). https://doi.org/10.1038/s41598-026-38391-0
Keywords: flood susceptibility, machine learning, Choke Watershed, remote sensing, disaster risk reduction