Clear Sky Science · en
Risk maps for urban fire with geospatial model-based framework
Why city fires matter to everyday life
City fires are not just rare disasters we glimpse on the evening news. Around the world, fires claim lives every day, destroy homes and businesses, and quietly drain national economies. As cities grow denser and more complex, understanding exactly where fires are most likely to happen becomes essential for deciding where to put fire stations, how to design new neighborhoods, and which communities need extra protection. This study introduces a new way to make detailed “fire risk maps” for cities, showing which blocks are most at risk and why.
Looking for hidden patterns in city fires
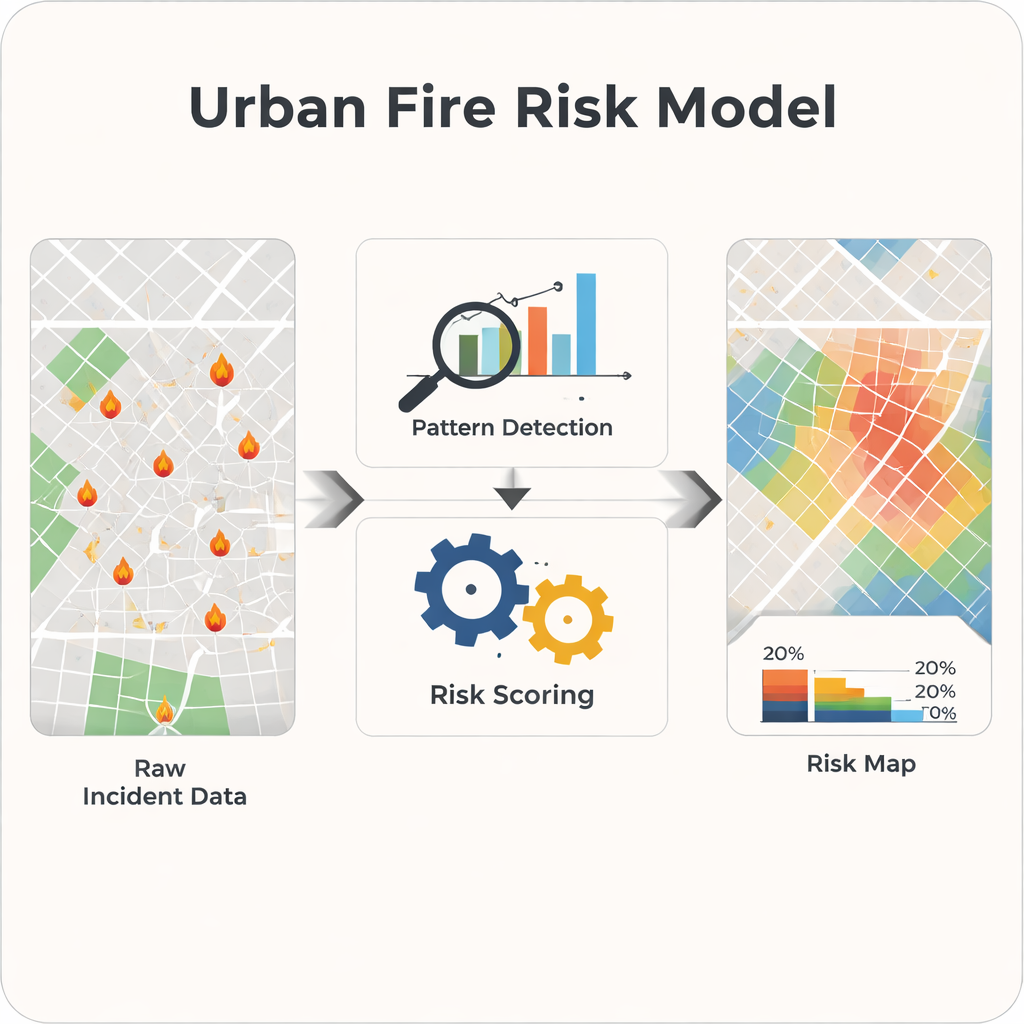
The authors focus on an urban district in Xiaoshan, China, a rapidly developing area of about two million residents with nearly 5,000 recorded fires between 2020 and 2023. Instead of simply counting fires by large administrative zones, they divide the city into a regular grid of small squares and ask two questions: at what size of grid do fires show the clearest pattern, and what features of the city best explain where those fires occur? To find the right level of detail, they test many grid sizes and use two statistical measures, one that spots clustering and another that checks how cleanly the city can be divided into groups with similar fire behavior. This allows them to move beyond rough heat maps and toward a sharper, block-by-block view of risk.
What makes some blocks burn more than others
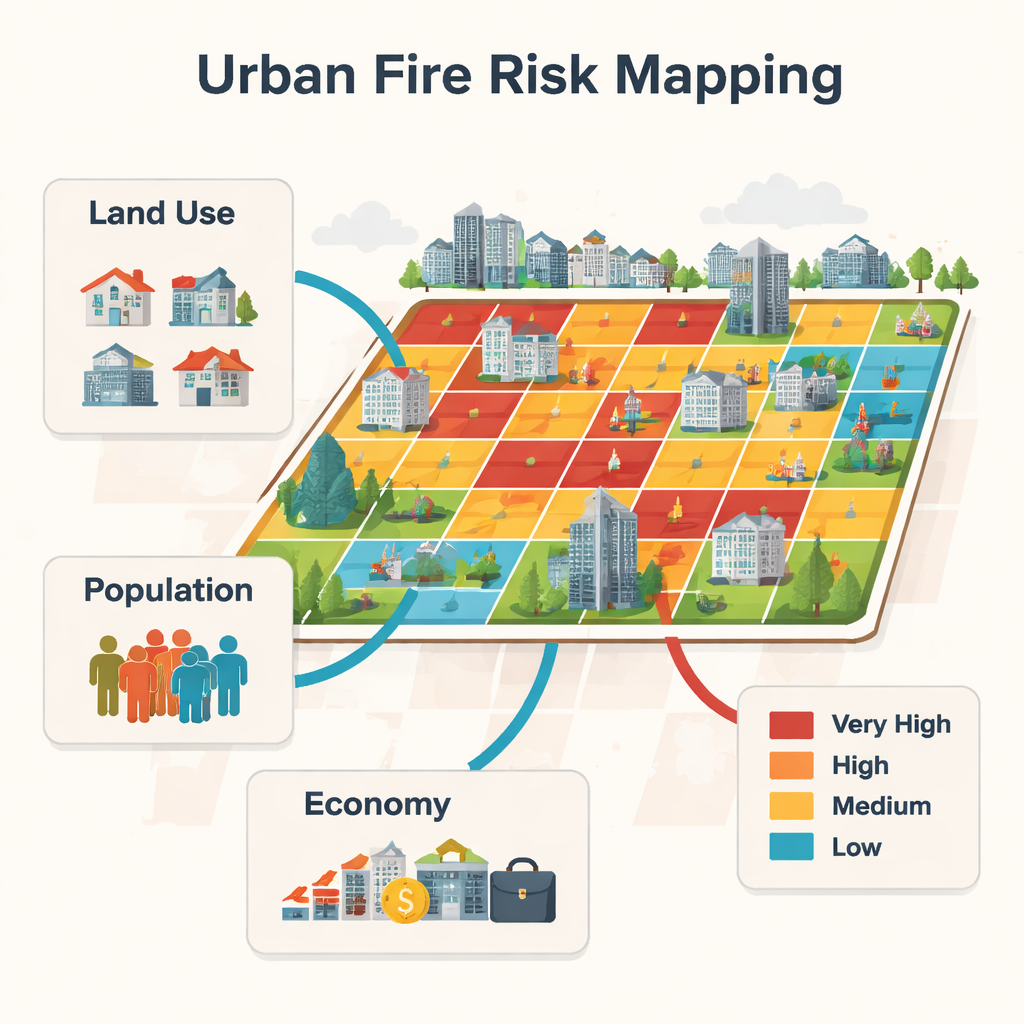
Past studies often blamed city fires on general social factors such as income, education, or unemployment, measured over big areas like whole districts or provinces. This work adds a new ingredient: fine-grained land-use data, describing whether each small grid cell is mainly residential, commercial, industrial, for public services like schools and hospitals, for transport, or left undeveloped. Combined with population density and local economic output, these layers let the researchers ask how the physical shape and everyday use of the city steer fire risk. They find that residential and commercial areas, where people cook, use appliances, and gather in large numbers, are especially prone to fires, while empty or undeveloped land contributes very little.
Building a smarter fire risk model
Once the team settles on an optimal grid size of about 500 meters—fine enough to see neighborhoods but broad enough to filter out random noise—they turn to a statistical model designed for count data, which captures how often fires happen in each grid square. Because some squares see many more fires than others, a simple model would be misleading. Instead, they use a technique called negative binomial regression, which can handle this unevenness while teasing out the influence of each factor. The analysis shows that where people live and how densely they are packed together explain roughly half of the variation in fire risk across the city. Residential land stands out as the strongest predictor, followed by population density, commercial land, and then other built uses; economic output adds a smaller but still meaningful effect.
A city shaped by the 80/20 rule
When the researchers convert the model’s results into a map, a striking pattern emerges. Only about one fifth of the city’s land area falls into the “medium,” “high,” or “very high” risk categories—but that small share of ground accounts for around four fifths of all recorded fires. In other words, fire risk is highly concentrated in a limited set of hotspots, mainly in dense residential neighborhoods, busy commercial zones, and industrial parks. The rest of the city, while not risk-free, sees far fewer incidents. This echoes the well-known 80/20 rule, where a minority of causes produce the majority of outcomes.
How these maps can make cities safer
For non-specialists, the takeaway is simple: city fire risk is not spread evenly like a blanket; it clumps in predictable places shaped by how we build and use urban space. By combining detailed land-use plans with population and economic data, city planners and fire departments can forecast where tomorrow’s fire hotspots will be—even before new neighborhoods are finished. That knowledge can guide where to place new fire stations and hydrants, which buildings need stricter safety checks, and how to design safer, less fire-prone districts from the start. In this way, the study offers a practical roadmap for turning raw fire statistics into targeted, life-saving decisions.
Citation: Wu, K., Lu, S., Jiang, Y. et al. Risk maps for urban fire with geospatial model-based framework. Sci Rep 16, 7702 (2026). https://doi.org/10.1038/s41598-026-38373-2
Keywords: urban fire risk, spatial risk mapping, land use planning, fire hotspots, city resilience