Clear Sky Science · en
Application of time-lagged satellite image-based crop coefficients for estimating actual evapotranspiration through FAO-56 method
Why Old Satellite Snapshots Matter for Today’s Farms
In dry regions, every drop of water pumped from underground aquifers matters for both farmers and towns. Yet it is surprisingly hard to know how much water crops are actually using across an entire watershed, day after day. This study explores a practical shortcut: can we reuse satellite information from a decade ago, instead of constantly processing new imagery, and still get reliable estimates of how much water crops are consuming today?
Watching Thirsty Fields from Space
Plants lose water to the air as they grow, a process known simply as “water use” or, more technically, evapotranspiration. Measuring this water use directly requires expensive equipment that records energy and moisture exchanges above fields. Such gear works for single research plots, but not for vast farming regions with mixed crops. Satellites offer a way out: by capturing patterns of light and heat from the land surface, they can be used to estimate how much water crops are using over large areas. The challenge is that turning these raw images into water use numbers usually demands heavy calculations, specialized expertise, and frequent updates.
A Simple Recipe Using Old and New Data
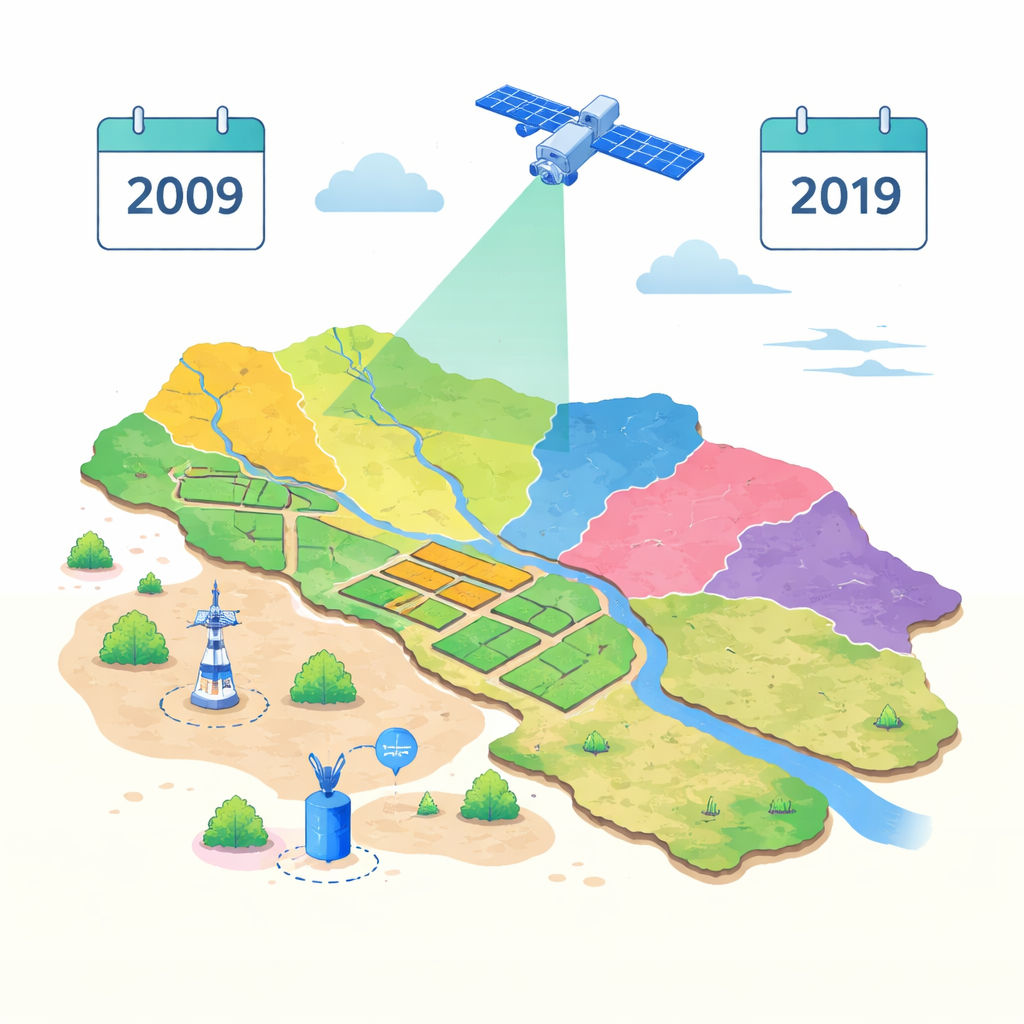
The researcher focused on the Neishaboor watershed in northeastern Iran, an arid to semi-arid area where about half the land is cultivated and groundwater is heavily tapped for irrigation. The key idea was to treat an older year, 2009, as a detailed “training snapshot.” First, satellite images from that year were combined with a well-tested energy balance method, called SEBAL, to estimate daily crop water use for each pixel. At the same time, standard weather data from a local station were used in a guideline approach from the UN Food and Agriculture Organization (known as FAO-56) to calculate how much water a reference crop would use under ideal conditions.
Turning Pictures into Reusable Crop Signatures
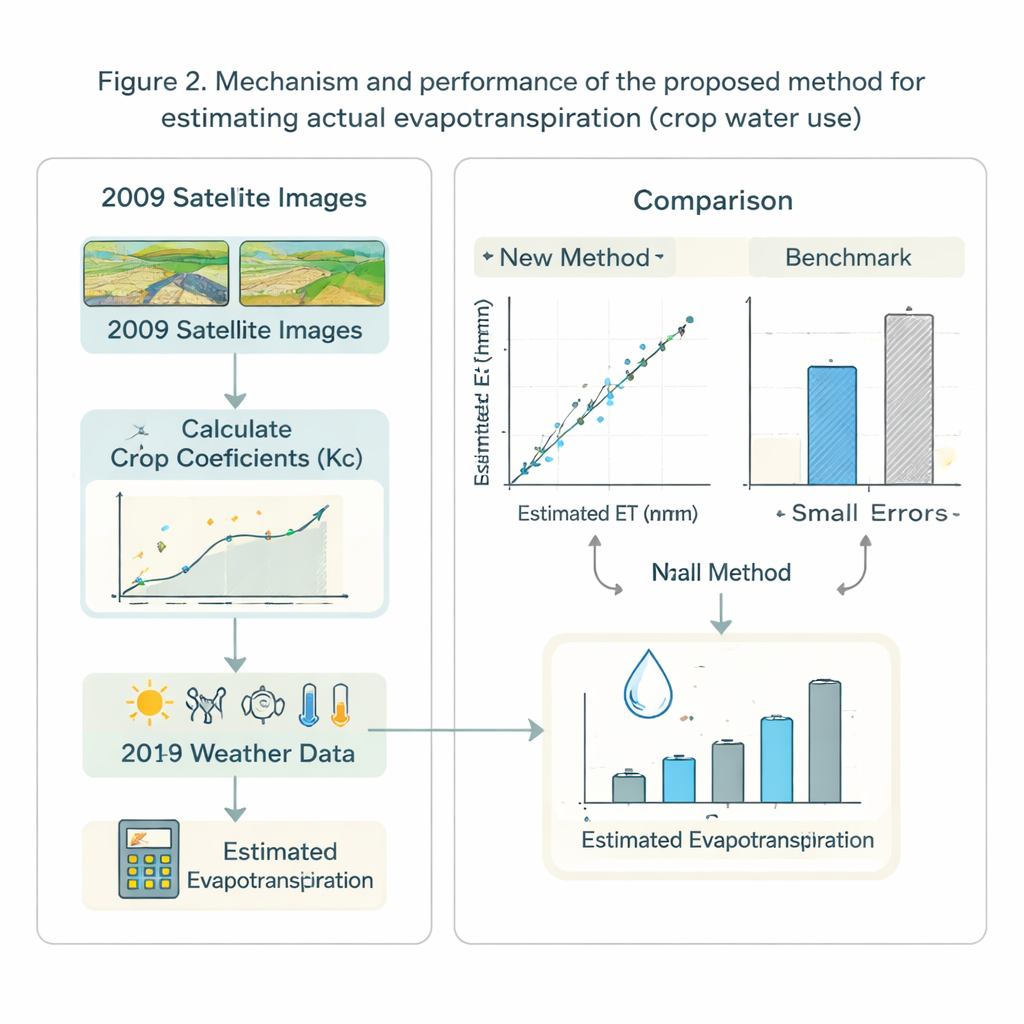
By dividing the satellite-based water use by the reference water use for 2009, the study produced maps of “crop coefficients” – simple numbers that describe how thirsty the actual crops are compared with the ideal reference plant at each location. These coefficients capture the influence of crop type, growth stage, and local management in a compact form. The bold step in this work was to assume that these pixel-level coefficients from 2009 could still be useful ten years later. In 2019, instead of reprocessing new satellite images, the researcher took ordinary weather records for each month and multiplied them by the old coefficients to estimate current daily crop water use in the same months. These estimates were then checked against fresh 2019 satellite-based SEBAL calculations, treated as the benchmark.
How Close Were the Estimates?
The comparison was carried out for ten subbasins chosen across the watershed, mostly where irrigated farmland is concentrated. From April to October 2019, the average difference between the new shortcut method and the benchmark satellite calculations generally fell between about half a millimeter and one and a half millimeters of water per day. Errors tended to be smaller in the peak irrigation months, when fields were fully green and well watered, and somewhat larger in early spring. When errors were examined across low, medium, and high water-use days, the method did not show a strong bias toward always overestimating or always underestimating, which is attractive for long-term water accounting.
Limits of Relying on the Past
The study also highlights when this shortcut can fail. The biggest risk comes from changes in land use and cropping patterns between the “old” and “new” years. If farmers switch from wheat to orchards, expand or shrink irrigated areas, or alter irrigation schedules, then the decade-old crop coefficients can become outdated and introduce extra error. Shifts in climate – such as wetter or drier years – and changes in field management can also affect how well the old coefficients represent current conditions. The author suggests that shortening the time gap, for example using images from just a few years earlier, and better tracking land use changes would likely improve results.
What This Means for Water Management
For water managers working in data-poor, drought-prone regions, these findings are encouraging. They suggest that when up-to-date satellite processing is not feasible, previously derived crop signatures can still provide reasonably accurate estimates of how much water farms are using across a watershed. The approach simplifies the workload by turning a complex, image-heavy task into a more straightforward calculation driven by routine weather data. While it cannot replace detailed monitoring everywhere, and it depends on keeping an eye on how cropping patterns evolve, this method offers a practical tool to support decisions about irrigation, groundwater pumping, and long-term water planning.
Citation: Moazenzadeh, R. Application of time-lagged satellite image-based crop coefficients for estimating actual evapotranspiration through FAO-56 method. Sci Rep 16, 6859 (2026). https://doi.org/10.1038/s41598-026-38365-2
Keywords: evapotranspiration, remote sensing, crop water use, groundwater management, semi-arid agriculture