Clear Sky Science · en
Creep prediction of cellulose based materials by extrapolation of short term experiments
Why slow squashing of paper matters
Paper and cardboard might seem simple, but in high‑voltage power transformers they quietly hold everything in place and electrically insulated for decades. These transformers are the backbone of power grids, and their cellulose‑based insulation must withstand constant mechanical forces without deforming too much over time. This slow, continuous change in shape under steady load—called creep—can eventually threaten reliability. The study summarized here asks a practical question: can we use relatively short, manageable laboratory tests to reliably predict how such cellulose materials will deform over much longer periods, without resorting to years‑long experiments or complex accelerated aging schemes?
Paper boards inside giant electrical machines
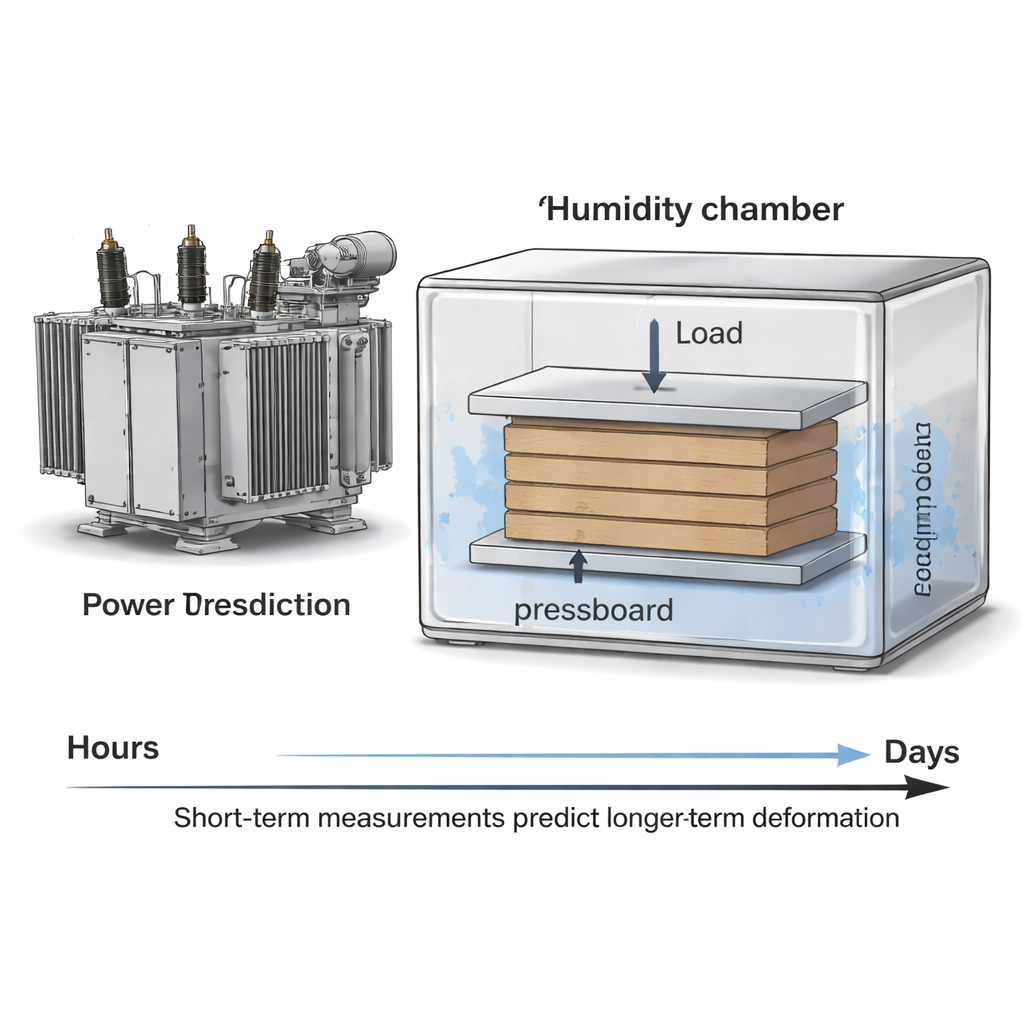
Inside power transformers, thick paper‑like boards made from softwood fibers act as solid insulation. These "pressboards" are made from long cellulose fibers bound in a network with tiny voids, giving them strength in the plane of the sheet but more softness through the thickness. In service, many components are compressed exactly in this weaker direction and held under constant load for years. Moisture and temperature make the behavior even more complicated. Because raising temperature to speed up tests can change how cellulose ages, standard accelerated testing may not give trustworthy long‑term predictions. The authors therefore focus on a simpler but demanding problem: under fixed humidity and temperature, can we infer long‑term creep from a limited window of carefully measured deformation?
Watching a tiny board creep for five days
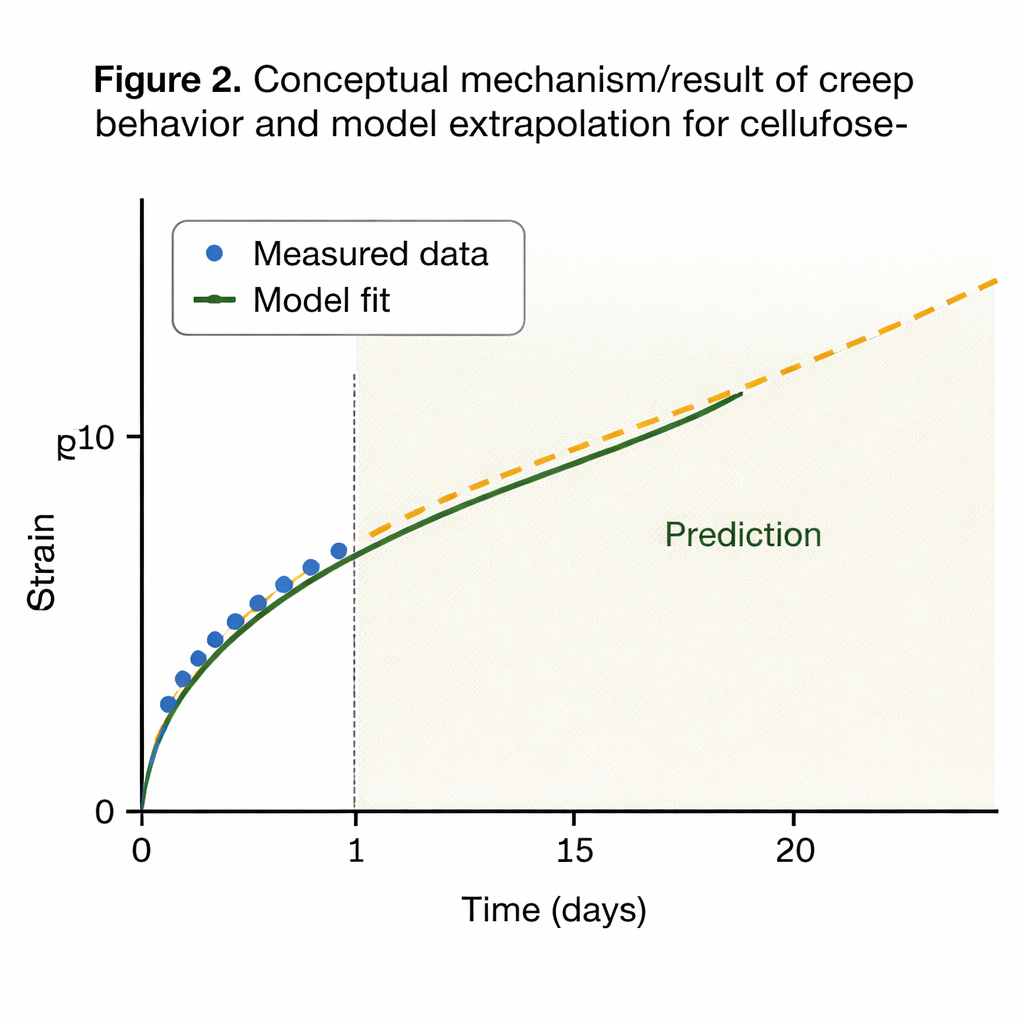
The researchers tested precompressed pressboard commonly used in transformers. They placed a sample in a controlled chamber at about 73% relative humidity and applied a constant compressive load corresponding to a stress of 2.33 megapascals—roughly the pressure under a sturdy clamp. Instead of just tracking the movement of the loading plates, they used digital image correlation, an optical technique that follows a random speckle pattern painted on the specimen surface. This method provides a full map of how different regions deform over time. Although the internal fiber structure makes the strain field patchy and non‑uniform, the average strain across a selected region grows smoothly over 120 hours. That averaged response becomes the basis for fitting and testing creep models.
Testing different ways to extend a short test in time
Creep in such materials is often described using rheological models that represent elastic springs and viscous dashpots combined in chains. Mathematically, this leads to a creep compliance that increases over time with several characteristic "retardation" times, each linked to a different deformation mechanism. The authors compare three strategies to identify these parameters from data. In a logarithmic approach, they fix a set of time scales spread over several orders of magnitude and fit the corresponding stiffness values. In a spectrum approach, they assume a smooth power‑law function describing how stiffness depends on time scale. In a viscous approach, they directly treat both the key stiffnesses and their associated time constants as unknowns to be found by optimization. For all three, they use an inverse analysis that minimizes the squared difference between model predictions and the measured creep curve, exploring many initial guesses to avoid misleading local optima.
How long must we measure to trust the forecast?
Using the full five days of measurements, the logarithmic approach can match the observed creep very closely, and the compliance spectrum shows that two main time scales dominate the behavior. However, when the fitting window is shortened, these fixed‑grid approaches begin to fail at extrapolation. Fitting only the first two days of data leads to inaccurate predictions for later days, even though the model still reproduces the early measurements well. The spectrum approach shows similar limitations. In contrast, the viscous approach, which allows the dominant time constants themselves to be identified from the data, succeeds: when only the first 24 hours are used to calibrate the model, it predicts the remaining four days of creep with an error below the scatter of the measurements—about 0.1% strain. This means that, under the tested conditions, a one‑day experiment can reliably forecast a five‑day response.
What this means for real‑world equipment
For engineers concerned with transformer lifetimes, the work provides a practical recipe: if the right kind of creep model is used—one that treats both stiffness and characteristic times as unknowns—and if humidity and temperature are kept constant, then relatively short creep tests can still underpin trustworthy long‑term predictions, at least over moderate time extensions. While the authors do not claim that a one‑year test will always predict five years, their results show that carefully designed short‑term measurements, combined with robust inverse modeling, can greatly reduce the experimental burden. Extending this strategy to different temperatures and moisture levels could ultimately help utilities and manufacturers design safer, longer‑lasting cellulose insulation without waiting years for data.
Citation: Abali, B.E., Afshar, R., Gamstedt, K. et al. Creep prediction of cellulose based materials by extrapolation of short term experiments. Sci Rep 16, 6358 (2026). https://doi.org/10.1038/s41598-026-38132-3
Keywords: creep, cellulose pressboard, power transformers, viscoelastic modeling, long-term prediction