Clear Sky Science · en
Comparison of noninvasive pressure-volume loops derived from cardiac magnetic resonance and transthoracic echocardiography in normal subjects
Why this heart study matters
Doctors increasingly rely on heart scans to decide who is at risk of heart failure and who is responding to treatment. Two popular scan types—cardiac magnetic resonance (CMR) and transthoracic echocardiography (TTE, a standard ultrasound of the heart)—can both be used to draw "pressure–volume loops," a graphical way to see how hard the heart works with each beat. This study asks a deceptively simple question with big practical consequences: if both scans claim to measure the same heart mechanics, do they actually give the same answers, or could switching methods during follow-up mislead doctors?
Two ways to look at a beating heart
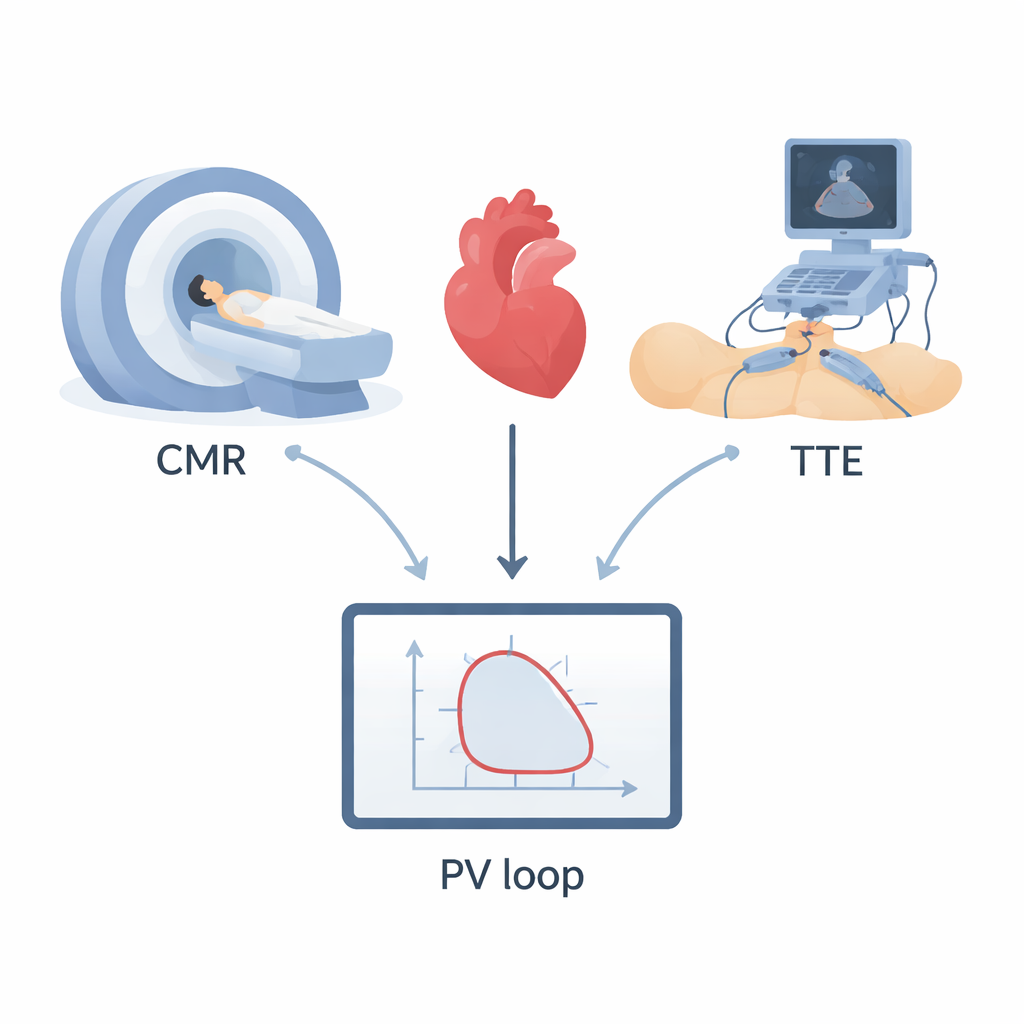
The researchers studied 20 healthy young adults in Kazakhstan who had both a CMR scan and a standard 2D echocardiogram within one week. CMR is often considered the most accurate imaging method for heart size and function, but it is expensive and less widely available. TTE, by contrast, uses ultrasound at the bedside, is cheaper, and is the workhorse of everyday cardiology. Using specialized software, the team combined the heart’s changing volume over time from each scan with blood pressure measured at the arm to build a pressure–volume loop—a closed curve showing how the left ventricle fills, builds pressure, and ejects blood during each heartbeat.
Turning loops into simple performance numbers
From each loop, the team extracted several key numbers that are increasingly being used in research and, slowly, in clinical decisions. These include how “stiff” the ventricle appears when it contracts (ventricular elastance), how stiff the arteries appear as they push back (arterial elastance), and how well heart and arteries are matched (ventriculo–arterial coupling). They also calculated stroke work (the mechanical work done to pump a single beat), the total pressure–volume area (a proxy for total mechanical energy), and work efficiency (the share of energy that actually moves blood instead of being stored as elastic tension in the heart muscle. All of these values can influence how doctors interpret early heart disease, the impact of high blood pressure, or the benefits of drugs and devices.
Same people, different numbers
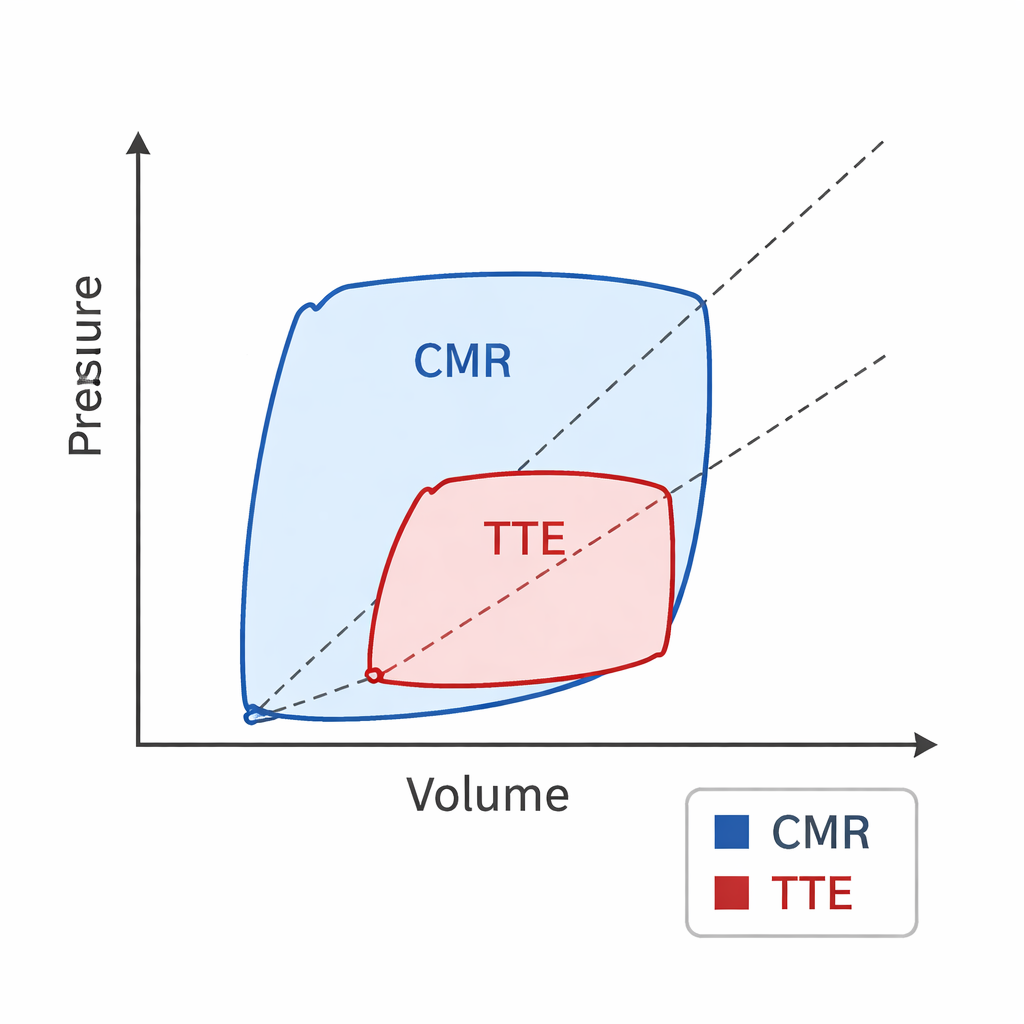
Despite scanning the very same healthy hearts, CMR and TTE did not agree on these pressure–volume measures. As expected from earlier work, TTE measured smaller heart volumes than CMR. Building on that, this study showed that when loops were derived from TTE, the heart and arteries looked stiffer: ventricular and arterial elastance values, and their ratio, were all higher. At the same time, stroke work, total pressure–volume area, and calculated efficiency were lower with TTE, because the loop drawn from ultrasound data occupied a smaller area on the pressure–volume plot than the loop from CMR. Bland–Altman analyses—a standard way to test agreement between methods—confirmed systematic differences between the two techniques even though most individual measurements fell within statistical limits of agreement.
Patterns preserved, but caution still needed
To find out whether these differences changed the basic physiology, the authors also looked at how loop-based measures related to familiar markers such as end-diastolic and end-systolic volume, stroke volume, and ejection fraction. Using correlation maps, they found that the overall patterns were similar for both CMR and TTE: when one parameter increased or decreased, the related changes in standard measures tended to move in the same direction, regardless of method. This means that although the absolute numbers disagree, the underlying relationships remain largely intact. Still, because some loop-based measures are being explored as predictors of outcomes like heart failure progression or survival, even modest shifts in value between methods could change risk classification for a given patient.
What this means for patients and future care
For a lay reader, the core message is straightforward: two different “cameras” looking at the same healthy heart can produce notably different mathematical portraits of how that heart works. The authors conclude that CMR and TTE cannot simply be swapped when tracking pressure–volume loop measures over time, especially during follow-up in research studies or patient care. Each method needs its own normal reference ranges, and future work should treat them as distinct tools rather than interchangeable yardsticks. In practical terms, if a doctor or trial starts monitoring these advanced heart mechanics with one imaging method, sticking with that same method is essential to avoid mistaking a change in technology for a change in the patient’s heart.
Citation: Zhankorazova, A., Khamitova, Z., Tonti, G. et al. Comparison of noninvasive pressure-volume loops derived from cardiac magnetic resonance and transthoracic echocardiography in normal subjects. Sci Rep 16, 7556 (2026). https://doi.org/10.1038/s41598-026-38095-5
Keywords: pressure-volume loop, cardiac imaging, echocardiography, cardiac MRI, ventriculo-arterial coupling