Clear Sky Science · en
Sepsis insult generates different vascular response phenotypes: an unsupervised time-series clustering preclinical study
Why this matters for patients with serious infections
Sepsis, a life‑threatening reaction to infection, can send blood pressure crashing and damage multiple organs within hours. Yet doctors still rely mostly on late‑appearing signs—like very low pressure or high lactate—to recognize when circulation is failing. This study in pigs asks a simple but important question: hidden inside the shape of each blood pressure pulse, are there early clues that the circulation is starting to unravel, and do different animals follow different paths into shock? If such patterns can be found, bedside monitors could one day warn clinicians earlier and help tailor treatment to each patient’s unique response.
Looking inside each heartbeat
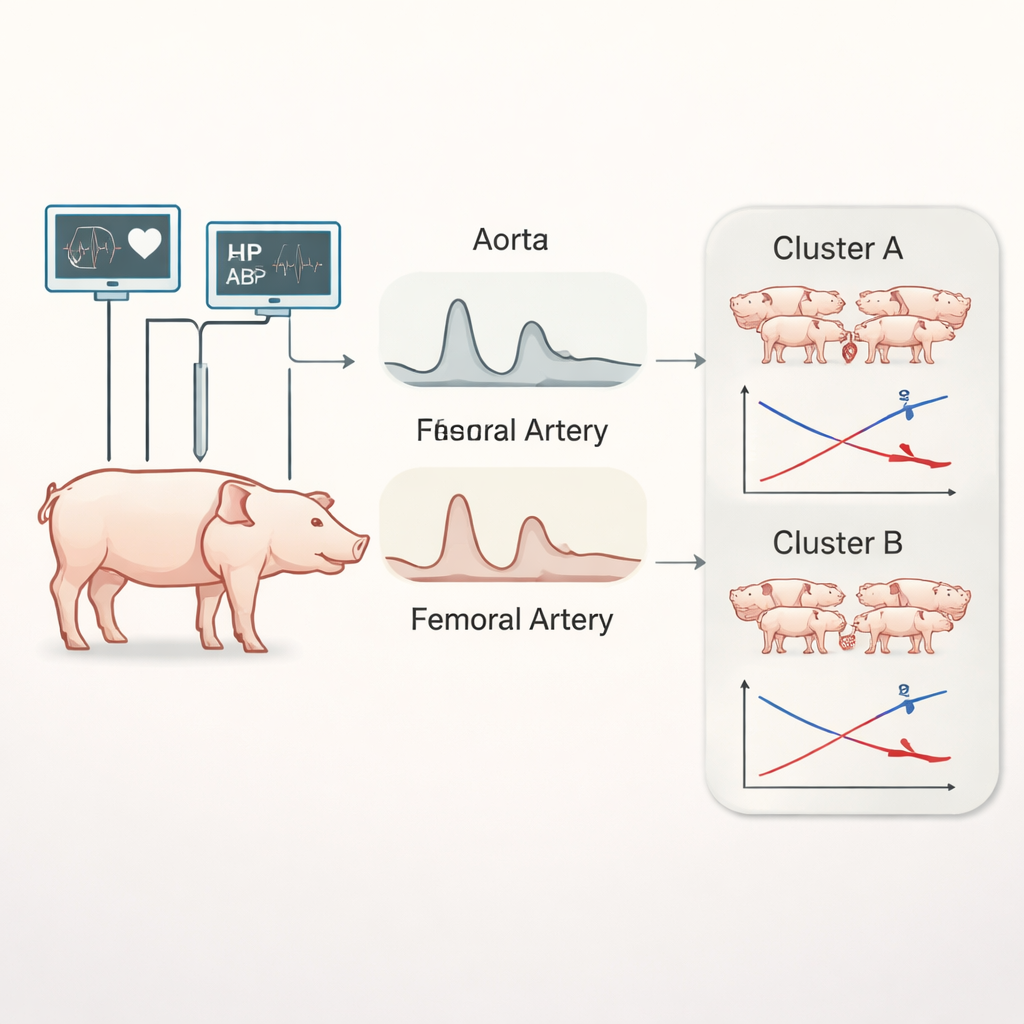
In intensive care units, an arterial line displays blood pressure beat by beat as a wavy trace on the monitor. Most of the time, clinicians focus on the simple numbers—mean pressure and pulse pressure—while the detailed shape of the wave is ignored. In this preclinical study, researchers continuously recorded high‑quality blood pressure signals from the main artery near the heart and from a leg artery in 40 pigs as they progressed from health to full septic shock induced by a controlled abdominal infection. Alongside familiar measures such as mean arterial pressure, heart rate, cardiac output, and pulse pressure, the team extracted newer indices that describe how elastic or stiff the vessels are, how strongly the nervous system regulates pressure, and how complex the pressure wave becomes as it travels through the body.
Two different roads into septic shock
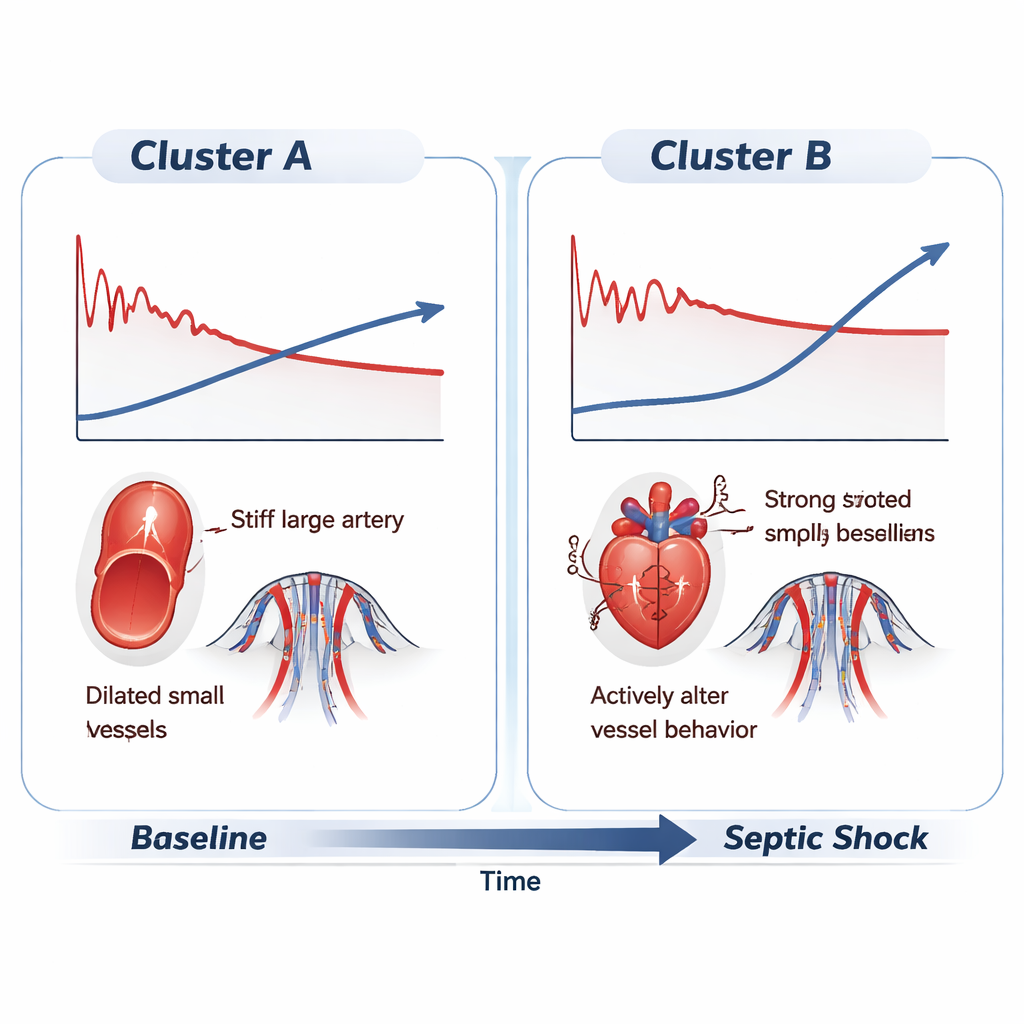
By following these measurements every two minutes over many hours, the investigators used unsupervised time‑series clustering—a form of machine learning that looks for natural groupings in data without pre‑labeling—to see whether the pigs’ cardiovascular responses fell into distinct patterns. Although by the time full septic shock developed all animals met the same clinical criteria—low mean pressure, fast heart rate, and reduced cardiac output—the analysis revealed two clear clusters of behavior. In one group, blood pressure began to slide soon after the infectious insult and continued a steady decline, with relatively modest increases in heart rate and cardiac output. These pigs seemed unable to mount a strong compensatory response and drifted into shock with gradually worsening circulation.
Hidden signals in the pulse wave
The second group showed a different story. For several hours, their blood pressure stayed closer to normal despite the infection. They achieved this stability by sharply increasing heart rate and maintaining cardiac output. Under the surface, however, the detailed waveform‑based indices told a more nuanced tale. A measure of how much the pulse pressure grows as it travels from the central aorta to the leg—the pulse pressure amplification—reversed in both groups, signaling a breakdown of the usual relationship between central and peripheral vessels well before obvious shock appeared. A time constant related to how quickly blood drains from the arteries during each heartbeat shortened, indicating leaky, dilated vessels. And an index of waveform complexity, called harmonic distortion, moved in opposite directions: in one group the pressure wave became smoother and simpler, while in the other it grew more complex, hinting at different patterns of vessel stiffening and wave reflection.
From complex data to simple patterns
To ensure these patterns were not statistical quirks, the researchers applied a technique known as shapelet analysis, which searches long time series for short segments that best distinguish one group from another. This method highlighted the same features: a steadily falling pressure pattern versus an initially preserved, then collapsing pattern; diverging trends in waveform complexity; and different trajectories in the interaction between heartbeats and the arterial tree. Notably, even before sepsis was induced, the pigs later falling into each cluster already showed subtle differences in indices related to vessel function and nervous‑system control, despite having similar standard blood pressure readings. This suggests that animals—and by extension, people—may arrive at sepsis with distinct underlying cardiovascular “set‑ups” that shape how they respond to the same insult.
What this could mean for future care
For non‑specialists, the main takeaway is that there is far more information in the blood pressure line on a monitor than just a single number. By analyzing the fine structure of each pulse over time, this work shows that it is possible to detect early changes in how arteries behave during sepsis and to uncover different “phenotypes” of vascular response that look identical by routine bedside criteria. If similar findings are confirmed in human patients, hospitals could enhance existing monitors with software that automatically tracks these waveform‑based markers. Such tools might flag patients at risk of rapid deterioration hours before traditional signs appear and help clinicians choose therapies that match each patient’s specific pattern of circulatory failure.
Citation: Vida, I., Carrara, M. & Ferrario, M. Sepsis insult generates different vascular response phenotypes: an unsupervised time-series clustering preclinical study. Sci Rep 16, 6960 (2026). https://doi.org/10.1038/s41598-026-37885-1
Keywords: sepsis, blood pressure waveform, vascular dysfunction, intensive care monitoring, machine learning