Clear Sky Science · en
Integrated modeling and observational analysis of light-saturated electron transport rates in four C3 species
Why this plant study matters
As carbon dioxide in the atmosphere climbs, scientists and farmers urgently need to know how crops will respond. Will plants grow faster and capture more carbon, or will hidden bottlenecks in their machinery hold them back? This study probes one of the hardest parts of photosynthesis to measure directly—the high-speed flow of energy-carrying electrons inside leaves—and asks whether a widely used textbook model is actually getting that story right for real plants.
Peeking inside the leaf’s power lines
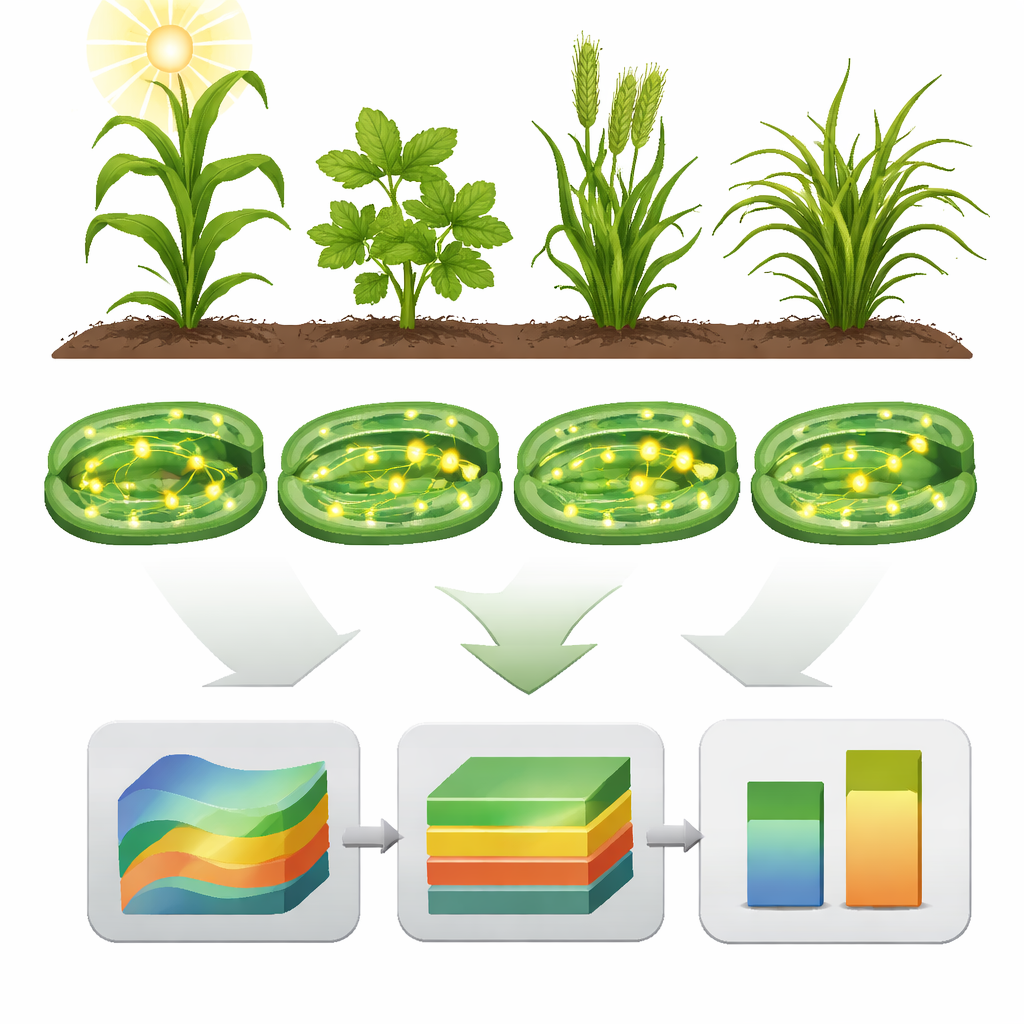
Inside green leaves, sunlight drives streams of electrons that power the making of sugars from carbon dioxide. The stronger the light, the more these invisible “power lines” are pushed toward their maximum capacity. Plant scientists often rely on a mathematical framework called the Farquhar–von Caemmerer–Berry (FvCB) model to estimate that maximum capacity, known as the maximum electron transport rate. Instead of measuring it directly, they infer it from how photosynthesis responds as the air around a leaf is enriched with carbon dioxide. This approach is built into many crop and climate models, so its accuracy has real consequences for predictions of food production and carbon cycling.
Testing models against real leaves
The researchers focused on four familiar C3 crop and vegetable species—sweet potato, yam bean, pepper, and okra—grown in the field under good conditions. Using a sophisticated gas-exchange system combined with chlorophyll fluorescence, they recorded how each leaf responded both to changes in light and to a wide range of carbon dioxide levels. From these measurements they built two kinds of curves: one tracking the rate at which leaves took up carbon dioxide, and another tracking the rate at which electrons flowed through the light-harvesting machinery. This dual approach allowed them to compare what the FvCB model predicted with what the leaf actually did.
Where the standard formulas fall short
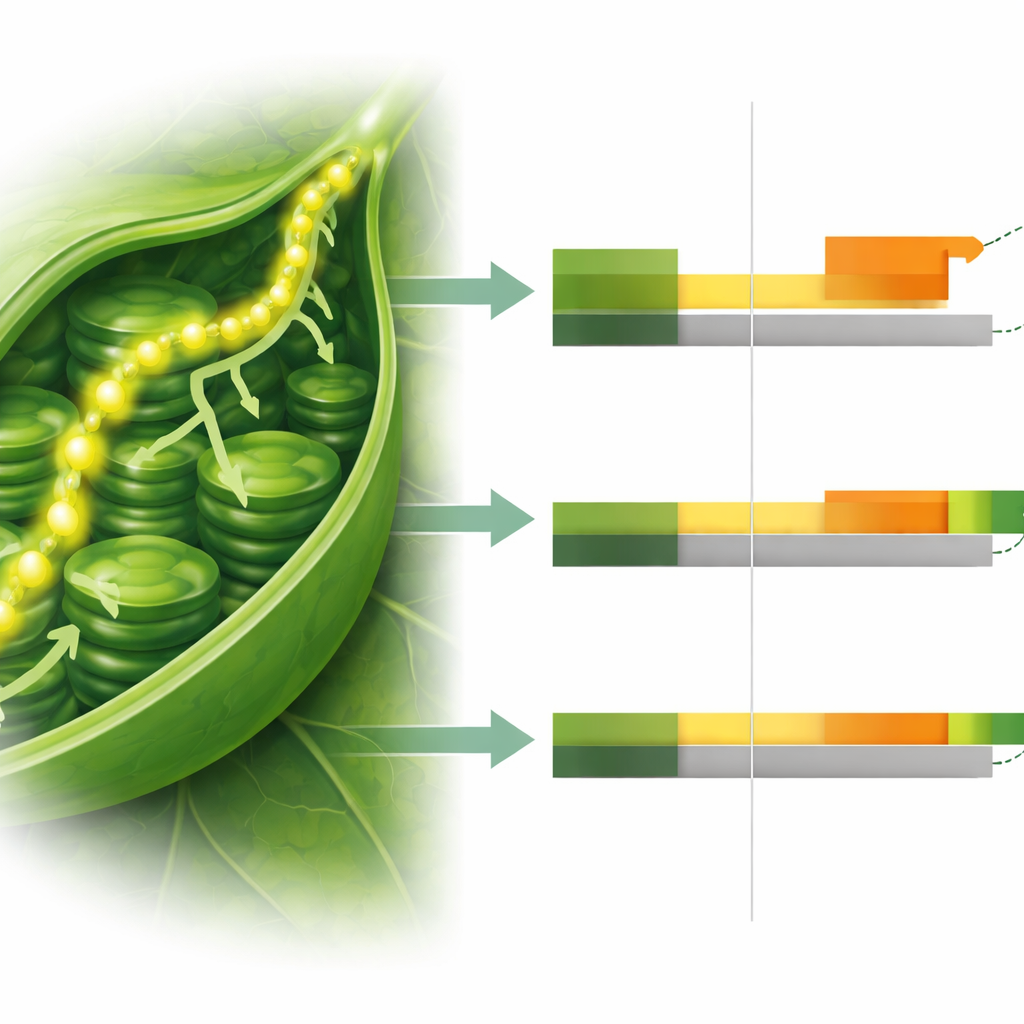
The FvCB framework includes two slightly different internal formulas, or sub-models, for describing the electron flow during the stage when carbon recycling inside the leaf becomes the main brake on photosynthesis. Theory says that the measured whole-chain electron flow should always be at least as large as the portion used for building sugars, because some electrons are inevitably diverted into side jobs like photorespiration and nutrient processing. Yet in three of the four species, one of the FvCB sub-models routinely predicted a maximum electron flow higher than what was directly observed. In okra, both sub-models overshot the measurements, breaking the basic accounting rule that the total stream cannot be smaller than one of its branches.
A simpler curve that fits better
To see whether this problem lay in the data or in the model, the team also applied an alternative, empirical curve that directly describes how electron flow responds to carbon dioxide, without building in strong assumptions about where the electrons go. When they fitted this curve to the fluorescence-based measurements, its estimates of maximum electron flow agreed extremely well with what the instruments recorded for all four species. This contrast—large mismatches for one widely used theoretical sub-model, smaller but still troubling mismatches for the other, and close agreement for the empirical curve—suggests that some of the FvCB model’s internal assumptions about how electrons are divided among different processes may not hold across species.
What this means for crops and climate forecasts
In plain terms, the study shows that a cornerstone photosynthesis model can misjudge how hard the leaf’s electrical “wiring” is working, especially in certain crops. For modelers, this is a caution flag: using the standard formulas without checking them against direct electron-flow measurements could lead to biased estimates of how plants respond to rising carbon dioxide. For agriculture and ecology, the work provides both a warning and a path forward. It highlights the need to refine photosynthesis models to better capture species-specific behavior, and it points to a practical empirical tool that can help anchor those models in real measurements. As researchers extend this combined modeling and measurement strategy to more species and to stressed conditions such as drought or heat, they will be able to build more reliable forecasts of plant performance in a changing climate.
Citation: Ye, Z., Xiao, Y., Kang, H. et al. Integrated modeling and observational analysis of light-saturated electron transport rates in four C3 species. Sci Rep 16, 7916 (2026). https://doi.org/10.1038/s41598-026-37741-2
Keywords: photosynthesis modeling, C3 crops, electron transport, chlorophyll fluorescence, climate-ready agriculture