Clear Sky Science · en
Big data-driven establishment and bias comparison of serum ferritin reference intervals in Zhejiang Chinese adults using six algorithms
Why this matters for everyday health
Iron is essential for carrying oxygen in the blood, but too little or too much can be harmful. Doctors often rely on a blood test called serum ferritin to judge the body’s iron stores, yet the “normal range” printed on lab reports usually comes from small manufacturer studies, not from real people in the community. This study used big sets of medical check‑up data from adults in Zhejiang, China to build more accurate local reference ranges and to test several modern computer methods for defining what counts as a healthy ferritin level.
Using real‑world data instead of tiny samples
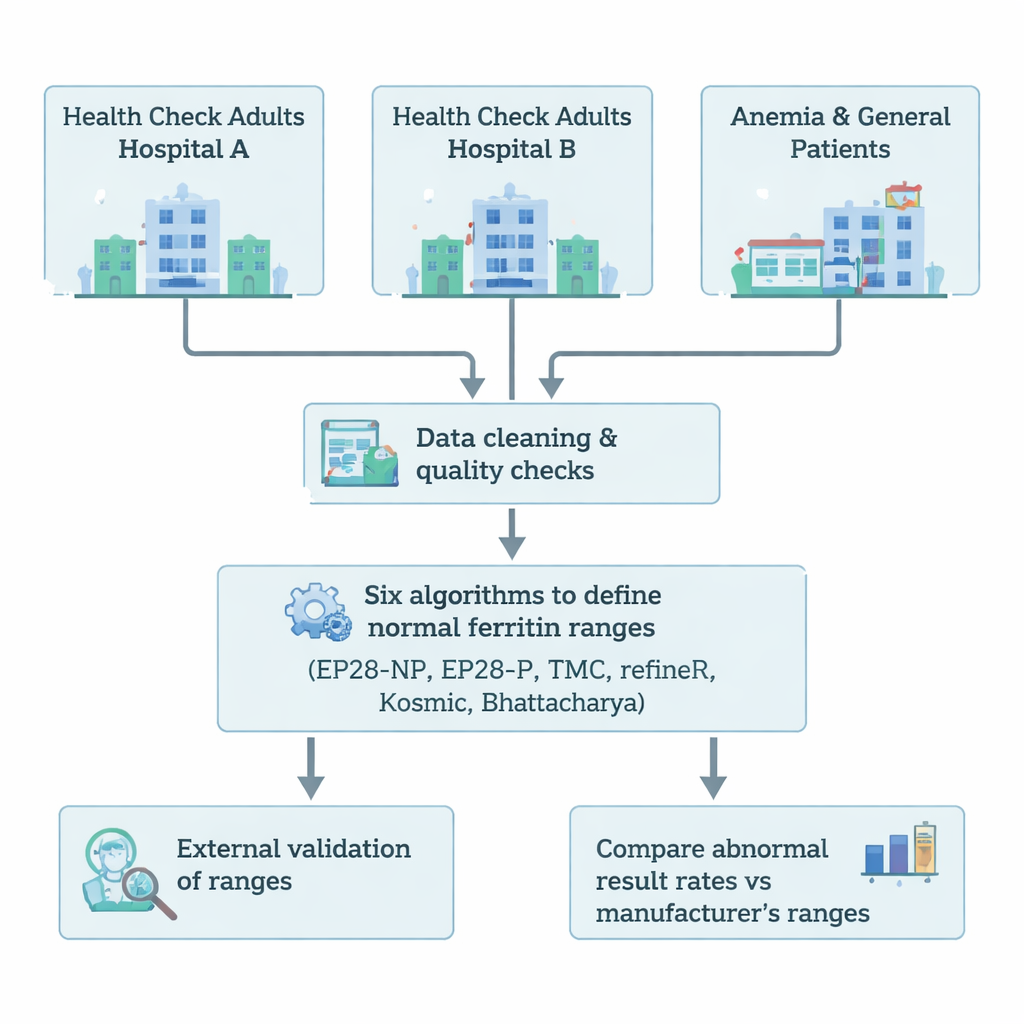
The researchers gathered ferritin results from more than 77,000 adults who had health check‑ups at a large hospital in Hangzhou. After removing duplicates, people with missing information, pregnant women, and anyone whose other test results suggested infection, liver or kidney disease, cancer, anemia, or metabolic problems, they ended up with 22,359 apparently healthy adults. A second hospital using the same testing equipment contributed 555 more people to check whether the new ranges would hold up in an independent group. An additional 327 patients with anemia and over 24,000 general outpatients and inpatients were used to see how well the new ranges flagged real iron problems.
Old rules versus new algorithms
To define who is “normal,” the team compared six statistical approaches. Two followed traditional international guidelines: a simple non‑parametric method based on percentiles and a parametric method that assumes a bell‑shaped distribution. Four others—TMC, refineR, Kosmic, and Bhattacharya—are newer, computer‑intensive techniques designed to sift out the healthy portion of large mixed datasets without first hand‑picking volunteers. Another flexible modeling tool, GAMLSS, was used to create smooth, age‑dependent curves that show how ferritin levels change continuously over adulthood.
Different iron patterns for men and women
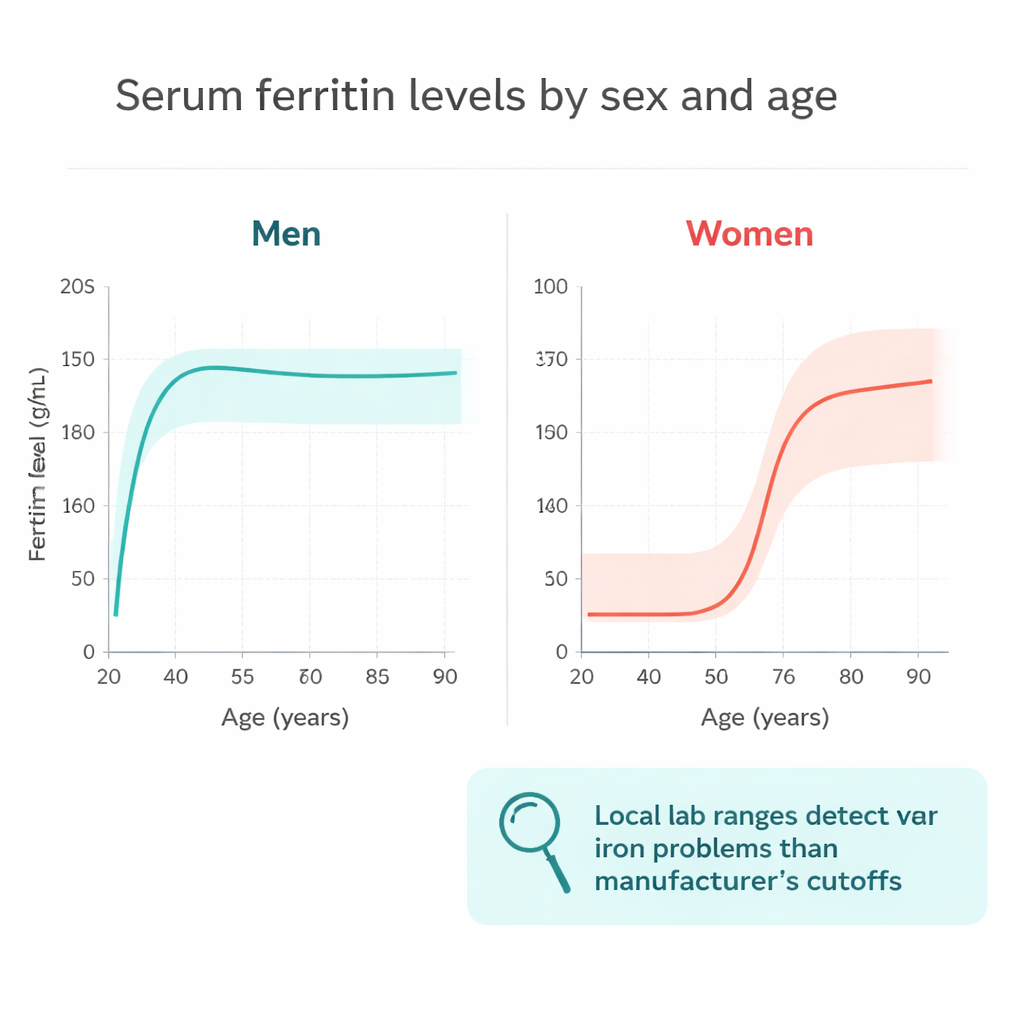
The analysis confirmed that ferritin levels differ sharply by sex and age. In this Chinese population, men aged 20–92 years had a broad reference range of about 69–496 ng/mL. Women needed to be split into three life stages: 20–45 years (roughly 10–133 ng/mL), 46–58 years (14–242 ng/mL), and 59–90 years (44–349 ng/mL). Women’s levels were much lower than men’s before menopause but climbed steeply around the perimenopausal years and continued to rise more slowly after age 60, reflecting the loss of menstrual blood and changing hormone levels. Continuous age‑curves showed a rapid rise in ferritin among young men in their 20s and a clear surge among women in their late 40s and 50s, supporting the idea that “one‑size‑fits‑all” cutoffs are misleading.
Big data exposes hidden iron problems
When the researchers compared their locally derived ranges to the factory‑supplied ranges from the test manufacturer, they found important differences. The manufacturer’s limits were generally lower for men and did not account for age‑related changes in women. Using the new, data‑driven intervals nearly tripled the detection of ferritin abnormalities in anemia patients—from 13.2% to 33.6%. For example, among young adult women with anemia, the proportion flagged as having abnormal ferritin more than doubled. At the same time, the new upper limits reduced the number of hospitalized men who appeared to have iron overload, likely cutting down on unnecessary worry and follow‑up testing.
What this means for patients and doctors
For the everyday patient, this work underscores that the “normal range” on a lab report is not universal. It depends on local habits, genetics, test methods, sex, and age. By mining large amounts of routine laboratory data, hospitals can tailor ferritin reference intervals that better match the people they serve. In this study, such customized ranges improved the recognition of iron deficiency in anemia and reduced false alarms for iron overload. The authors suggest that clinical laboratories should move away from generic manufacturer tables, choose analysis methods that fit their data, and provide sex‑ and age‑specific ferritin ranges. In practical terms, this can help doctors interpret iron tests more accurately and guide more personalized treatment.
Citation: Qi, X., Chen, P., Li, Y. et al. Big data-driven establishment and bias comparison of serum ferritin reference intervals in Zhejiang Chinese adults using six algorithms. Sci Rep 16, 6235 (2026). https://doi.org/10.1038/s41598-026-37641-5
Keywords: serum ferritin, iron deficiency, reference intervals, big data, anemia