Clear Sky Science · en
Fast learning-free organoid quantification and tracking with OrganoSeg2
Why tiny lab-grown tissues matter
In labs around the world, scientists now grow miniature versions of human tissues called organoids. These tiny, 3D clumps of cells can mimic how real organs or tumors behave, making them powerful tools for studying disease and testing treatments. But there is a bottleneck: researchers may collect thousands of low‑magnification microscope images of organoids, yet struggle to measure how each one grows, changes shape, or dies over time. This paper introduces OrganoSeg2, a redesigned piece of software that turns those plain, gray images into rich, reliable measurements about every individual organoid—without needing artificial intelligence training or expensive image setups.
A new way to read crowded microscope pictures
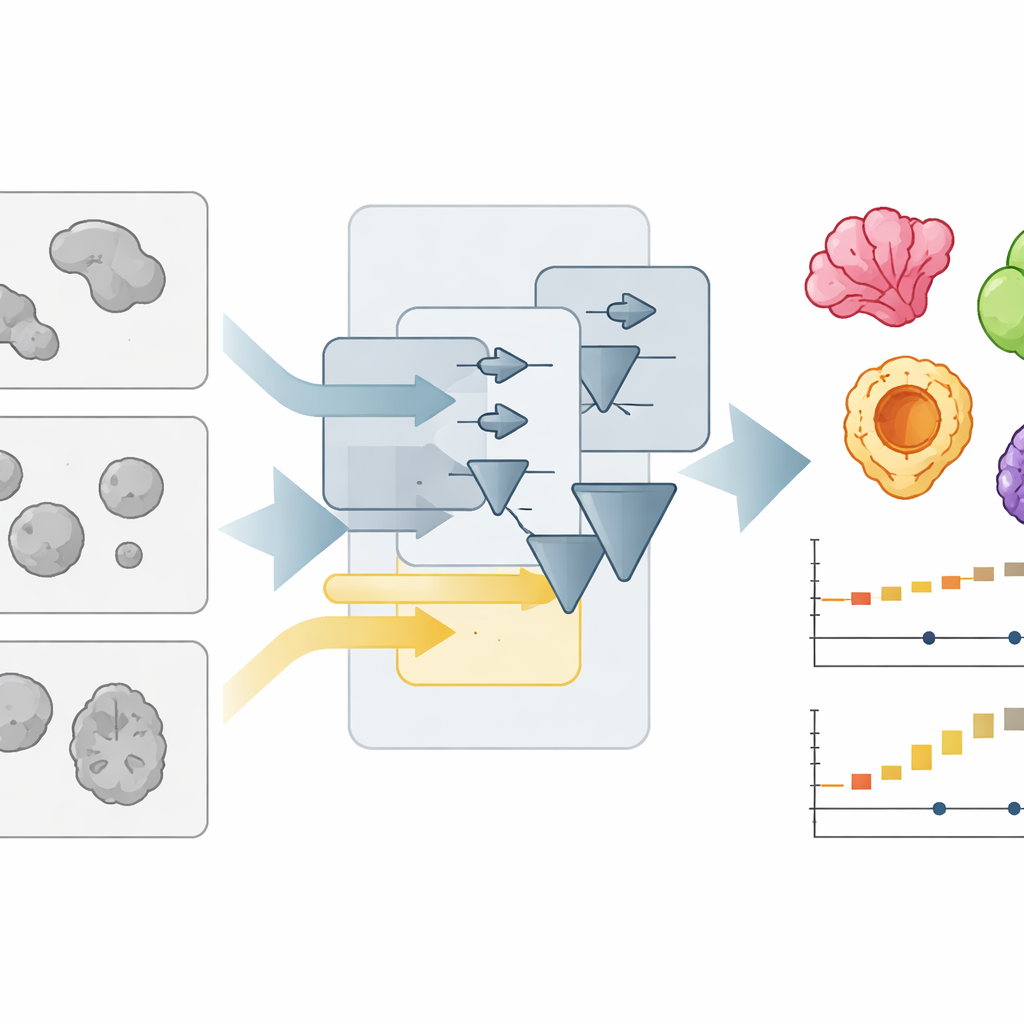
Organoids are usually imaged with simple brightfield microscopes, which show them as faint, overlapping blobs. Automatically outlining each blob—"segmenting" the image—is much harder than it looks, especially when labs use different culture formats, lighting, or lenses. The authors previously created OrganoSeg, a program that could handle basic segmentation but slowed down and became cumbersome when image collections grew into the hundreds. With OrganoSeg2, they rebuilt the software from the ground up in a modern interface, streamlined the internal code, and exposed several hidden settings so users can fine‑tune how the program separates organoids from background, splits neighbors that touch, and ignores artifacts at the edges of the image. The app now keeps these choices as metadata so that analyses are reproducible and sharable.
Speeding up the work without sacrificing detail
Beyond flexibility, the team focused heavily on speed and the user experience. In earlier versions, the software automatically calculated every possible measurement for every organoid, even when only a few were needed. OrganoSeg2 instead computes only what the user selects and reorganizes related calculations so that time‑consuming steps are reused efficiently. It also trims how much information is drawn on screen, shows labels only when needed, and adds keyboard shortcuts and interactive tools for quickly removing debris or non‑organoid objects. These design choices cut common operations—such as segmenting images, displaying outlines, and exporting data—by roughly ten‑fold, making it practical to handle large, tiled images and long time‑lapse experiments on an ordinary computer.
Outperforming high-tech rivals on real data
To test how well OrganoSeg2 works, the authors compared it to several other segmentation tools, including deep learning systems that must be trained on manually labeled examples. They assembled image sets from six different sources—such as colon, lung, pancreas, brain, and breast organoids, as well as embryoid bodies—where human experts had already traced the organoid borders. Using a standard accuracy score that measures how much the automated outlines overlap with the manual ones, OrganoSeg2 matched or beat specialized tools on most datasets and clearly led the pack on challenging breast cancer images full of stray material and oddly shaped organoids. Notably, OrganoSeg2 achieved this performance without needing tens of thousands of training examples and ran at least as fast as its competitors, even those based on artificial intelligence.
Following each organoid’s life story
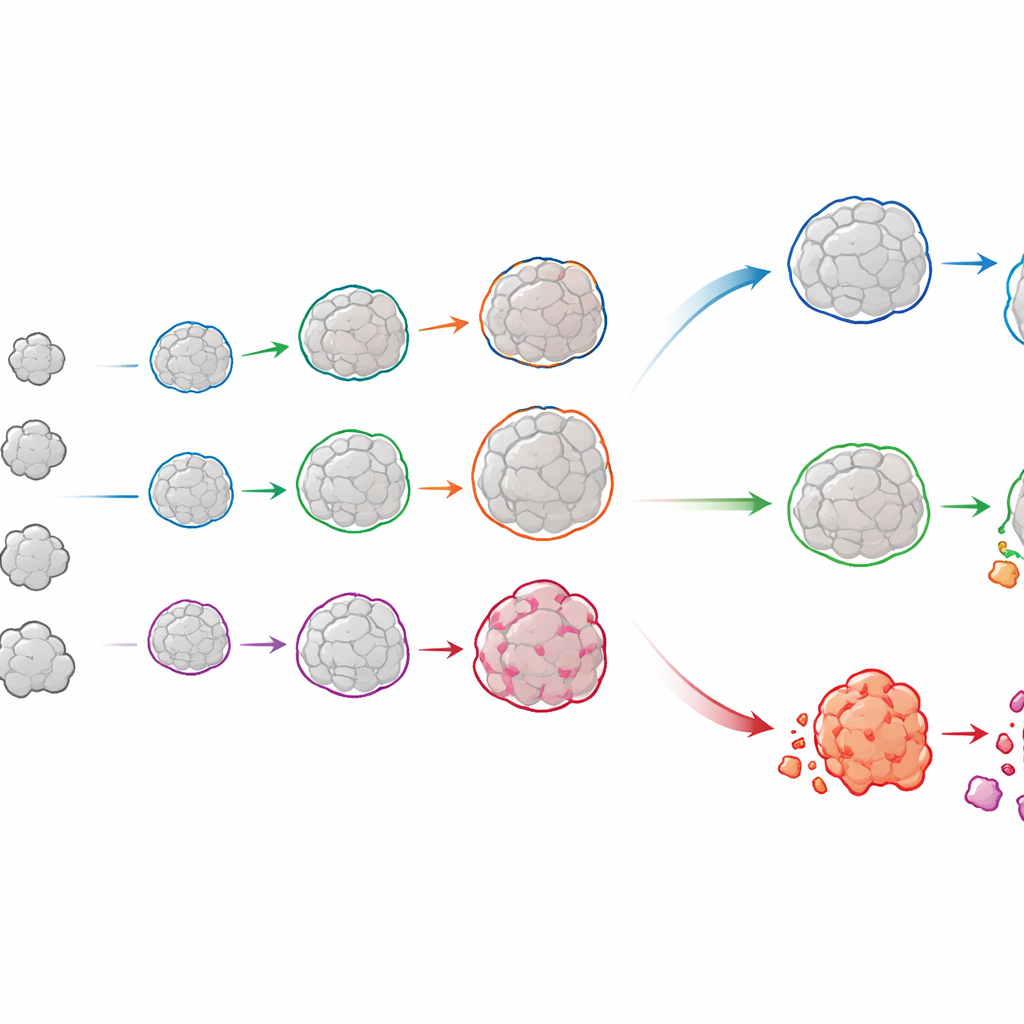
OrganoSeg2 does more than outline organoids in single snapshots. It can align images taken on different days and link the same organoid across time, building a growth history for each one. When the authors applied this to organoids grown directly from patients’ luminal breast tumors, they saw that individual organoids rarely grew smoothly; instead, many slowed or plateaued, mirroring how real tumors contain a mix of fast‑ and slow‑growing regions. By fitting these trajectories to a simple growth model, the team could quantify both how quickly each organoid expanded and how large it was likely to become. Comparing these patterns across patients revealed that tumors with similar overall growth could hide very different mixes of underlying behaviors—differences that might matter for predicting treatment response.
Watching cancer cells live and die under radiation
The software also links brightfield pictures with fluorescent dyes that report on cell health. In new experiments, the authors exposed breast cancer organoids to radiation doses similar to those used in the clinic and stained them with a live-cell marker that lights up during programmed cell death, along with a second dye that reveals dead cells at the final time point. OrganoSeg2 used the brightfield image to define the organoid shape and then measured the fluorescent signals within each one over many days. This allowed the team to track, organoid by organoid, when radiation triggered death and how strongly. Some patients’ organoids barely responded, while others showed high sensitivity even at lower doses, underscoring how variable tumor responses can be.
What this means for future research and care
Taken together, the work shows that careful, adjustable image processing can rival or surpass complex deep learning methods for a wide range of organoid images, while remaining transparent and easy to tune. OrganoSeg2 turns simple, low‑magnification movies of organoids into detailed records of how each tiny tissue grows and survives under different conditions. For basic researchers, it offers a robust way to dissect the hidden diversity within organoid cultures. For cancer studies in particular, it opens the door to using patient‑derived organoids not just for yes‑or‑no drug screens, but for rich, time‑resolved measurements of growth and cell death that may one day help tailor treatments more precisely.
Citation: Wells, C.J., Labban, N., Showalter, S.L. et al. Fast learning-free organoid quantification and tracking with OrganoSeg2. Sci Rep 16, 7928 (2026). https://doi.org/10.1038/s41598-026-37526-7
Keywords: organoids, image analysis, cancer research, microscopy, radiation response