Clear Sky Science · en
Thyroid cancer detection and classification using spectral imaging and artificial intelligence
Why spotting thyroid cancer early matters
Thyroid cancer is the most common cancer of the hormone‑producing glands, and its diagnosis still depends largely on what a pathologist sees through a microscope. Yet even experts can disagree, especially for borderline cases that look partly harmless and partly worrisome. This study describes a new way to read standard thyroid tissue slides using advanced light measurements and artificial intelligence, with the goal of helping doctors separate normal tissue from cancer more accurately and consistently.
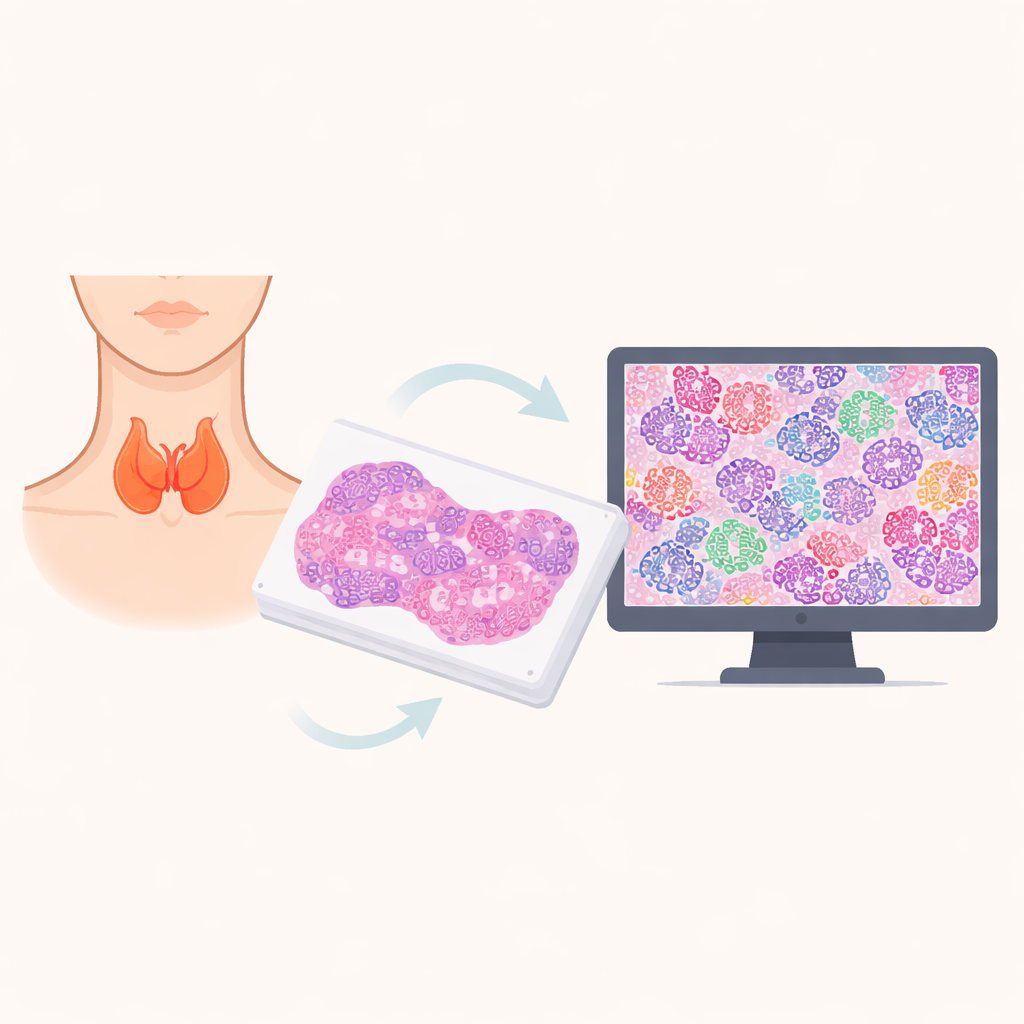
Looking beyond ordinary color in tissue slides
In everyday practice, thyroid tissue removed during surgery is thinly sliced, stained in pink and purple, and examined under a microscope. The colors come from two dyes, hematoxylin and eosin, which highlight cell nuclei and surrounding tissue. Traditional digital scanners turn this into a simple red‑green‑blue (RGB) image, much like a phone camera. The team behind this work built a different kind of imaging system, called spectral imaging, that measures how each tiny spot in the slide absorbs light across dozens of colors in the visible spectrum instead of only three. This richer "color fingerprint" captures subtle differences linked to how tightly packed and organized the genetic material is inside each cell’s nucleus, features that often shift in cancer.
Turning spectra of single cells into usable information
To make use of these detailed measurements, the researchers first had expert pathologists outline clearly normal and clearly tumorous regions on each slide. Their spectral microscope then scanned both areas in about 5–10 minutes per specimen, collecting around 40 light‑intensity values for every pixel. A specialized neural network, based on a design widely used in medical imaging, automatically found and outlined the nuclei of individual cells. For each nucleus, the system calculated its average spectrum and its size and shape, along with how much the spectrum differed from typical normal and typical cancer nuclei. In this way, what a pathologist sees qualitatively as "darker" or "more crowded" nuclei is translated into numerical features that a computer can analyze.
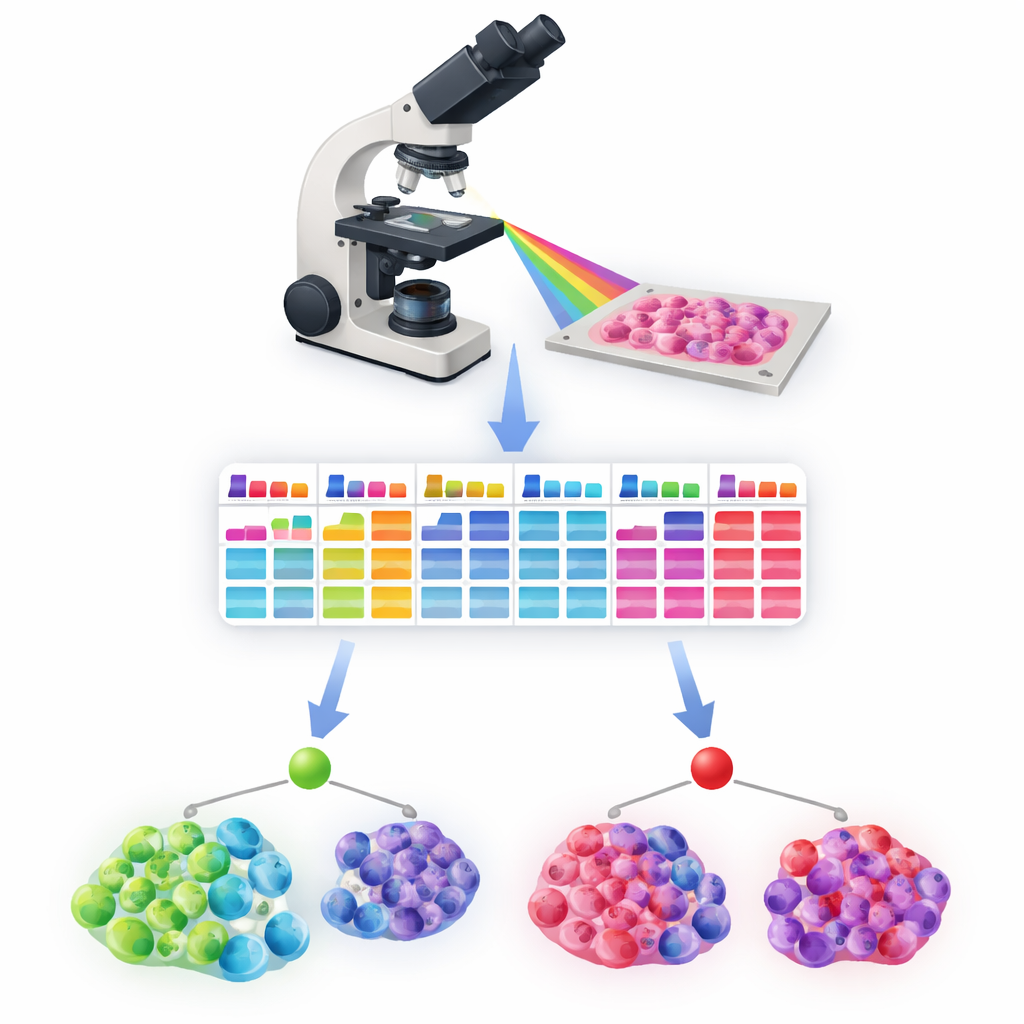
Two paths to sorting normal and cancerous cells
The study tested two complementary ways to classify cells. In a semi‑automated approach, a pathologist still marks one region as normal and one as tumor. The system then compares each nucleus’s spectrum to reference spectra from these two areas, using a simple clustering method to separate likely normal from likely cancer cells. This method achieved F1 scores—a balance of sensitivity and precision—around 0.8 or higher for the main thyroid cancer subtypes, improving further when borderline nuclei with mixed features were set aside. In a fully automated approach, a machine‑learning model called a random forest learned from more than 150,000 labeled nuclei to recognize patterns in nuclear size, shape, and spectral behavior that indicate cancer. Tested on separate patient cases, it also reached F1 scores above 0.82, without needing any manual region labeling.
From individual cells to whole‑tissue decisions
Doctors do not base treatment on the fate of a single cell, but on whether larger areas of tissue are cancerous and how far disease may have spread. The researchers therefore evaluated how their system performs when it groups cells into small sub‑regions and labels each region as tumor or normal if most of its nuclei look cancerous or not. This region‑based view raised accuracy further, especially by reducing false alarms in normal tissue. Importantly, the approach remained transparent: every decision can be traced back to visible cell features and spectra, avoiding the "black box" behavior that makes some deep‑learning tools hard to trust in the clinic.
What this could mean for patients and doctors
The study shows that adding detailed spectral measurements and carefully designed AI to routine thyroid slides can reliably highlight where cancer is present, even in tricky subtypes that often confuse experts. Because the method works on the same standard stains already used worldwide, it could be built into digital pathology workflows without changing how tissue is prepared. Rather than replacing pathologists, the system provides a map of likely normal and cancerous nuclei across the slide, helping confirm difficult diagnoses, speeding up reviews, and potentially lowering the risk of both missed cancers and unnecessary aggressive treatment.
Citation: Almagor, M., Shapira, Y., Soker, A. et al. Thyroid cancer detection and classification using spectral imaging and artificial intelligence. Sci Rep 16, 6509 (2026). https://doi.org/10.1038/s41598-026-37496-w
Keywords: thyroid cancer, digital pathology, spectral imaging, artificial intelligence, cancer diagnosis