Clear Sky Science · en
Direct evaluation of the electrocardiographic spatial QRS-T angle without the need for orthogonal transformation
Why the shape of your heartbeat matters
The familiar zig‑zag lines of an electrocardiogram (ECG) are more than just a heartbeat monitor; they hide subtle clues about the heart’s electrical health. One of these clues is the so‑called QRS‑T angle, which compares the direction of the electrical wave that makes the heart contract with the one that helps it relax. A wider angle has been linked to a higher risk of dangerous rhythm problems and even death. This study asks a practical question with big clinical implications: can we measure this important angle more simply and more accurately from the ECGs already recorded in everyday care?
A hidden risk signal in the ECG
For decades, researchers have known that when the QRS‑T angle is unusually wide, people are more likely to suffer serious heart events. This has been shown in many groups: survivors of heart attacks, people with heart failure or thickened heart muscle, patients on dialysis, and even in the general population. The angle captures how evenly or unevenly the heart’s muscle cells fire and recover; the more uneven the pattern, the more vulnerable the heart may be to sudden rhythm disturbances. Yet despite this promise, the QRS‑T angle is rarely used at the bedside, in part because the standard way to calculate it is mathematically complex.
Why the traditional method is so complicated
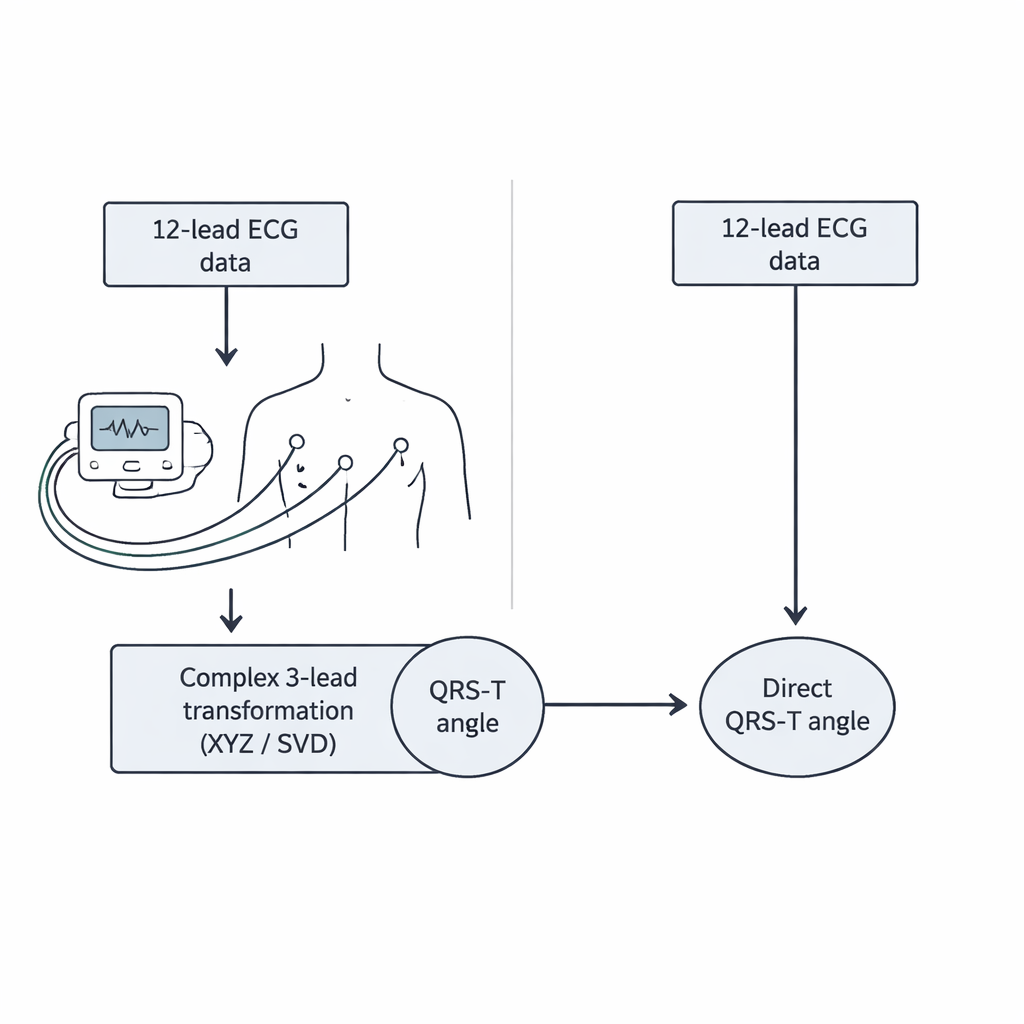
A standard ECG prints 12 different views of the heart’s electrical activity. To turn these 12 traces into a single three‑dimensional angle, current methods first convert them into three artificial “orthogonal” leads, usually called X, Y, and Z, or into a similar set of axes derived through a mathematical procedure known as singular value decomposition. Only after this transformation can the QRS‑T angle be computed. Each step adds assumptions and potential sources of error, and requires specialized software. Some researchers have tried to approximate the angle using only a few leads or a flat, frontal view, but the most reliable clinical studies have always relied on the full three‑dimensional angle, preserving the complexity.
A direct route from ECG to angle
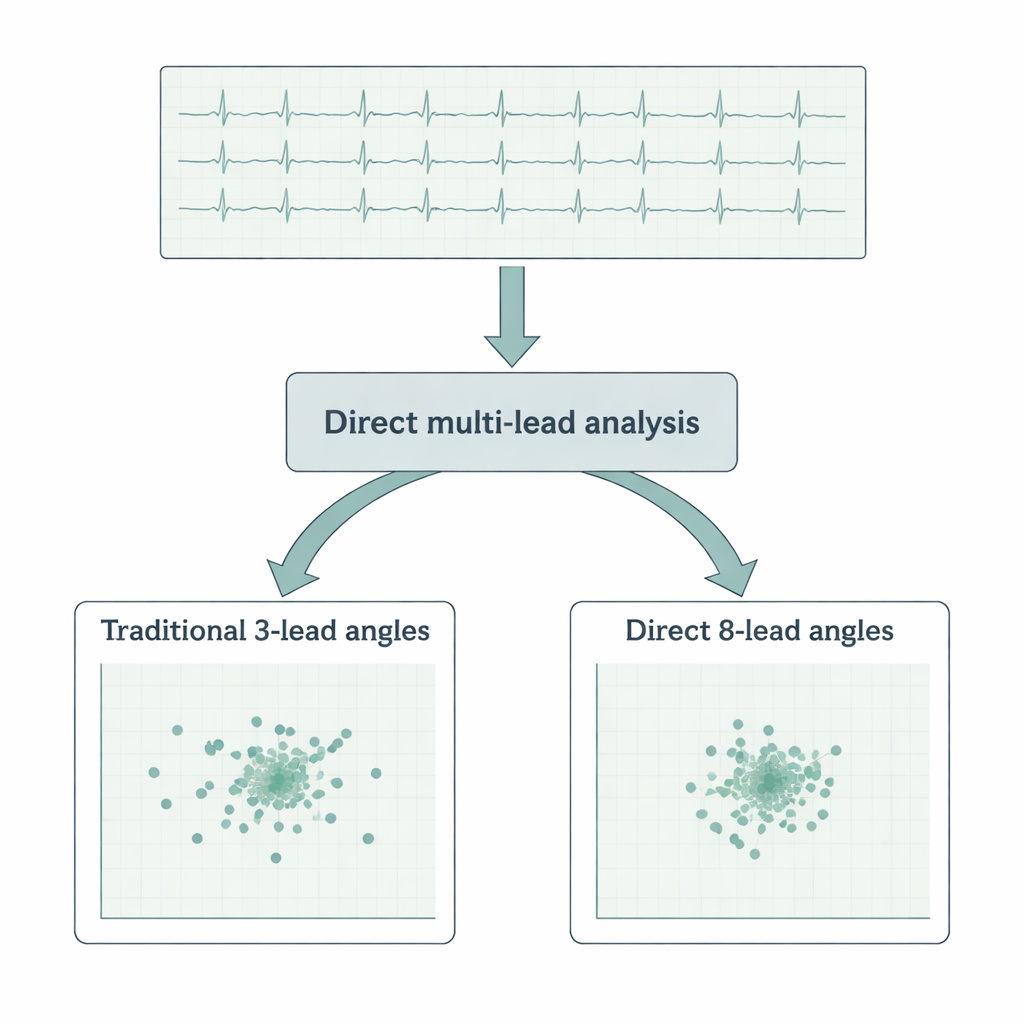
The authors of the present study wondered whether all those intermediate steps are truly necessary. They proposed a way to compute the QRS‑T angle directly from the original eight independent ECG leads (two limb leads and six chest leads), without any reshaping into artificial X, Y, or Z directions. To test this, they analyzed an enormous dataset: more than 650,000 ten‑second ECG samples containing over 7.3 million individual heartbeats from 523 healthy volunteers. For every beat, they calculated the QRS‑T angle three ways: using a standard XYZ conversion, using the more advanced singular value technique, and using their new direct method that treats the eight leads together as a higher‑dimensional view of the heart’s electrical field.
Sharper measurements with less noise
The first finding was reassuring: the direct method agreed very closely with the angles obtained by the sophisticated singular value approach, differing on average by well under a single degree, and by less than two degrees compared with the older XYZ method. But the real advantage appeared when the authors looked at stability and noise. They examined how consistently each type of angle followed changes in heart rate within the same person, and how much the angle wobbled from beat to beat over ten‑second snapshots. The direct method produced tighter patterns and smaller random fluctuations than either of the transformation‑based methods, especially when combined with an “integral” approach that takes into account the full shape of the QRS complex and T wave rather than just their overall size. In other words, the new calculation was not only simpler, it was also more precise.
What this means for patients and clinicians
To a lay reader, the technical details of multi‑lead vectors and polynomial regressions may sound remote, but the bottom line is straightforward. The QRS‑T angle is one of the most promising markers for identifying people at hidden risk of serious heart rhythm problems, yet it has been held back by the complexity of how it is measured. This work shows that the angle can be computed directly from ordinary 12‑lead ECG recordings without fancy coordinate tricks, and that doing so actually reduces measurement noise. If adopted into ECG software, the method could make a powerful risk signal easier to obtain, more reliable from beat to beat, and more widely available in routine clinics, emergency rooms, and even wearable devices that record multiple ECG leads.
Citation: Řehoř, J., Hnatkova, K., Pospíšil, D. et al. Direct evaluation of the electrocardiographic spatial QRS-T angle without the need for orthogonal transformation. Sci Rep 16, 7317 (2026). https://doi.org/10.1038/s41598-026-37361-w
Keywords: electrocardiogram, QRS-T angle, cardiac risk, heart rhythm, ECG analysis