Clear Sky Science · en
The impact of K selection in K‑fold cross-validation on bias and variance in supervised learning models
Why checking your model twice really matters
From medical diagnosis to credit scoring, many decisions now depend on machine‑learning models that are trained on past data. But how do we know whether a model that looks good on our computer screen will behave well on new, unseen cases? A popular way to "test" models is called k‑fold cross‑validation, where data are repeatedly split into training and testing chunks. This study asks a deceptively simple but crucial question: how many chunks—how big should k be—and how does that choice quietly shape the reliability of the model’s reported performance?
How data are sliced for a reality check
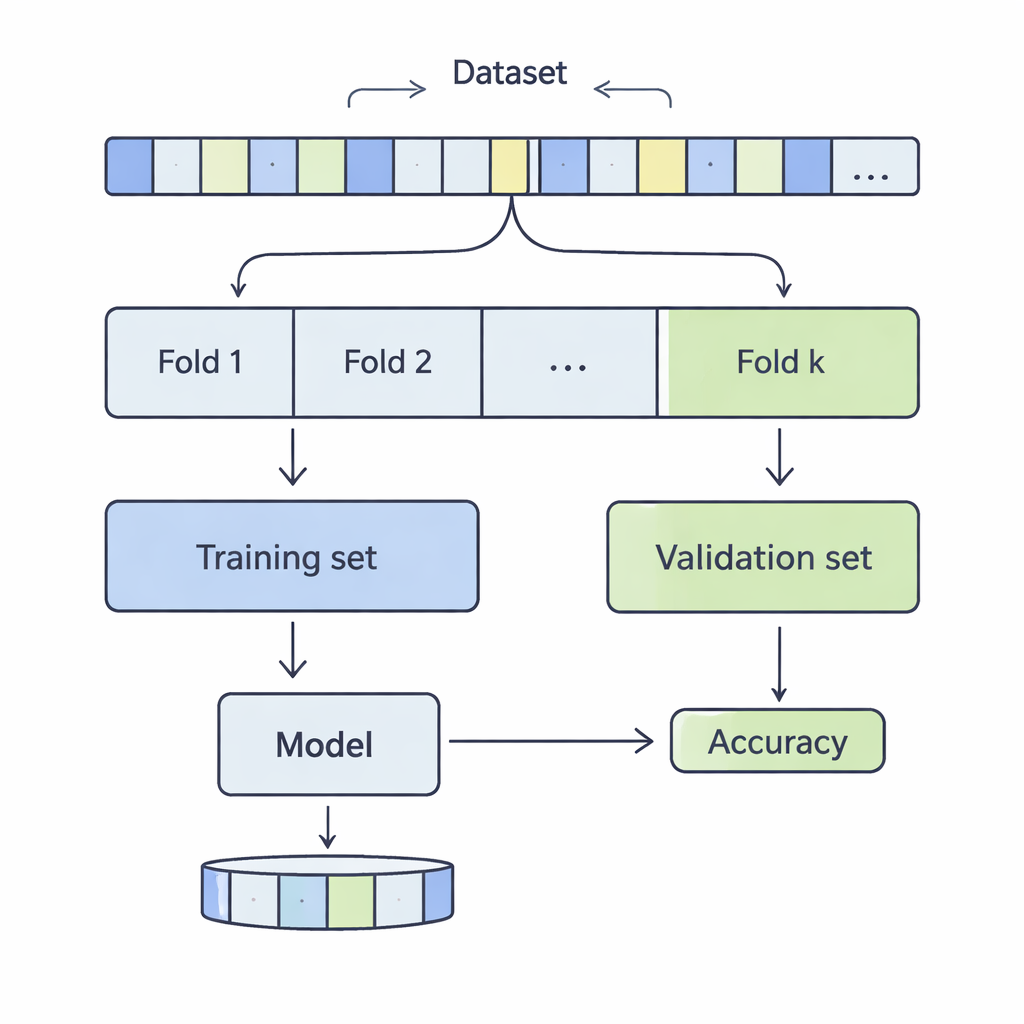
In k‑fold cross‑validation, a dataset is shuffled and divided into k equal parts, or folds. The model is trained on k‑1 of these folds and evaluated on the remaining one; this process repeats until every fold has taken a turn as the test portion. The authors examined k values from 3 to 20, across 12 real‑world datasets ranging from a few thousand to more than half a million records, covering areas such as income prediction, medical outcomes, cyber‑attacks, games, and wine quality. They applied four common classification methods—Support Vector Machines, Decision Trees, Logistic Regression, and k‑Nearest Neighbours—and carefully measured how the choice of k affected two key aspects of performance: bias and variance.
What bias and variance mean in everyday terms
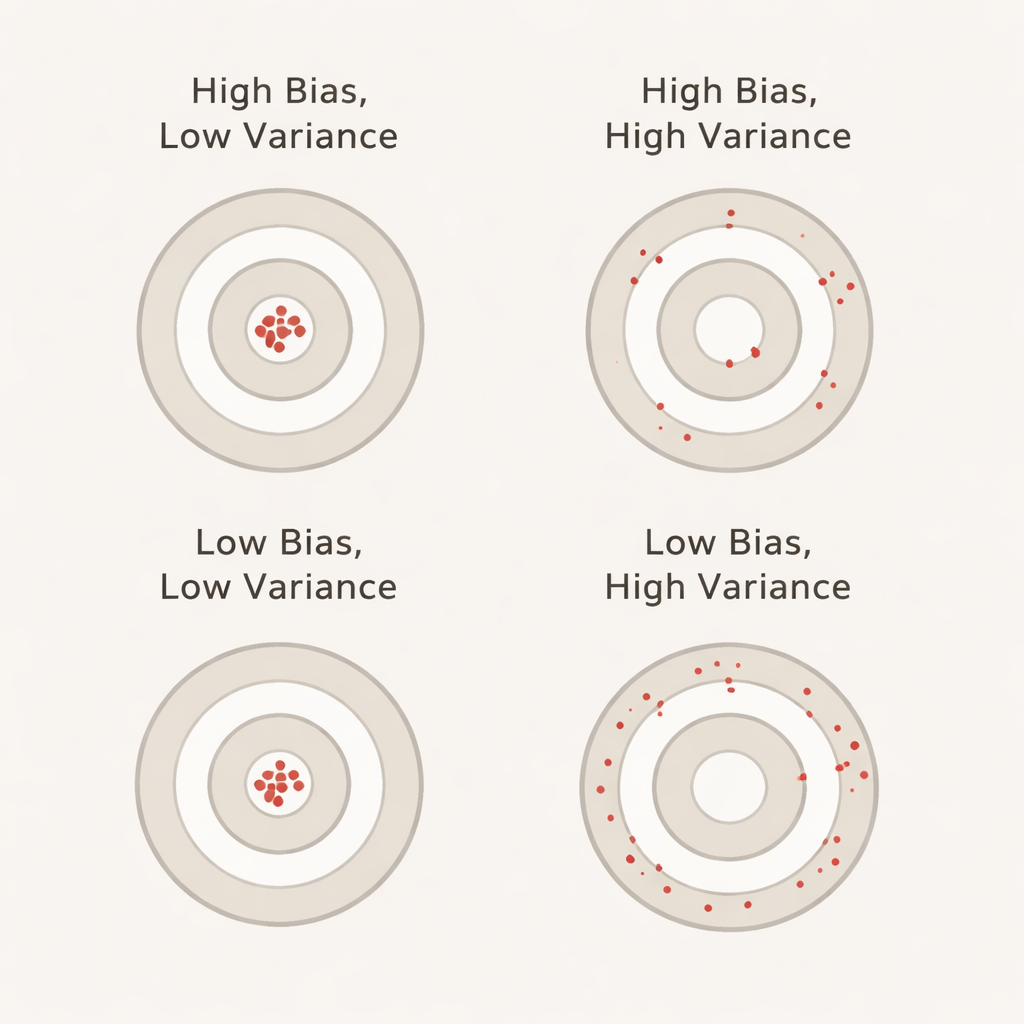
Bias, in this context, captures how much better the model appears to perform during cross‑validation than it actually does on a separate, untouched test set. A large positive bias means the model looks overly optimistic during validation—similar to a student who aces practice tests but stumbles on the real exam. Variance reflects how much the model’s performance jumps around from fold to fold: low variance means its scores are steady across different data slices, while high variance means they swing up and down. Ideally, we want both bias and variance to be low so that the reported accuracy is both realistic and stable.
What happens as we increase the number of folds
Across all twelve datasets and all four algorithms, one pattern stood out strongly: as k increased, variance almost always went up. In other words, using more folds made the reported accuracy less stable from one fold to another. This runs against a common belief that more folds automatically give better, more reliable estimates. The reason is that when k is large, each validation slice becomes very small and less representative, so results become more sensitive to quirks in the data. At the same time, bias behaved less uniformly. For k‑Nearest Neighbours and Support Vector Machines, bias tended to rise as k grew, meaning these models often seemed more accurate in cross‑validation than they were on the held‑out test set. Decision Trees showed roughly balanced patterns, and Logistic Regression landed in between, with mixed but more moderate bias changes.
Why the “standard settings” may be misleading
Most practical guides simply suggest using five or ten folds, regardless of the dataset or the learning algorithm. The authors’ analysis shows that such one‑size‑fits‑all advice can be misleading. On some datasets and for some models, higher k values amplified over‑optimistic impressions of performance; on all of them, more folds brought more variability in the estimates. This is especially worrisome in high‑stakes areas such as healthcare, finance, or infrastructure, where false confidence in a model’s accuracy can have real‑world consequences. The study argues that the effects of k depend on both the nature of the data (small vs. large, noisy vs. cleaner) and on how the specific algorithm learns from repeated, nearly identical training sets.
Take‑home message for anyone using machine learning
The central lesson is that the number of folds in cross‑validation is not a harmless technical detail—it directly shapes how trustworthy your accuracy numbers are. In these experiments, more folds consistently made results wobblier and often made some models look better than they truly were. Rather than blindly picking k=5 or k=10, the authors recommend treating k as a tuning knob: check how results change across a small range of k values and, where possible, look at more than one performance metric. For practitioners and interested readers alike, the message is clear: when it comes to evaluating machine‑learning models, how you slice the data can matter almost as much as the model itself.
Citation: Abedin, T., Xu, H. & Uddin, S. The impact of K selection in K‑fold cross-validation on bias and variance in supervised learning models. Sci Rep 16, 6084 (2026). https://doi.org/10.1038/s41598-026-37247-x
Keywords: k-fold cross-validation, bias-variance trade-off, model evaluation, machine learning validation, supervised classification