Clear Sky Science · en
Straightforward model-based approach using only field data and open-source maps to improve carbon stock estimates for REDD + projects
Why forest carbon on private lands matters
As the world leans on forests to slow climate change, a surprising bottleneck has emerged: we often don’t know, with much precision, how much carbon is stored in the trees on specific properties. That uncertainty matters because it underpins the carbon credits bought and sold in growing markets, especially for REDD+ projects that pay landowners to avoid deforestation. This study shows that landholders do not need expensive drones or custom satellite campaigns to get much better estimates. By combining basic field measurements with free, global maps, they can substantially sharpen their carbon numbers and create detailed maps of where the carbon actually is.
From a few plots to a full picture
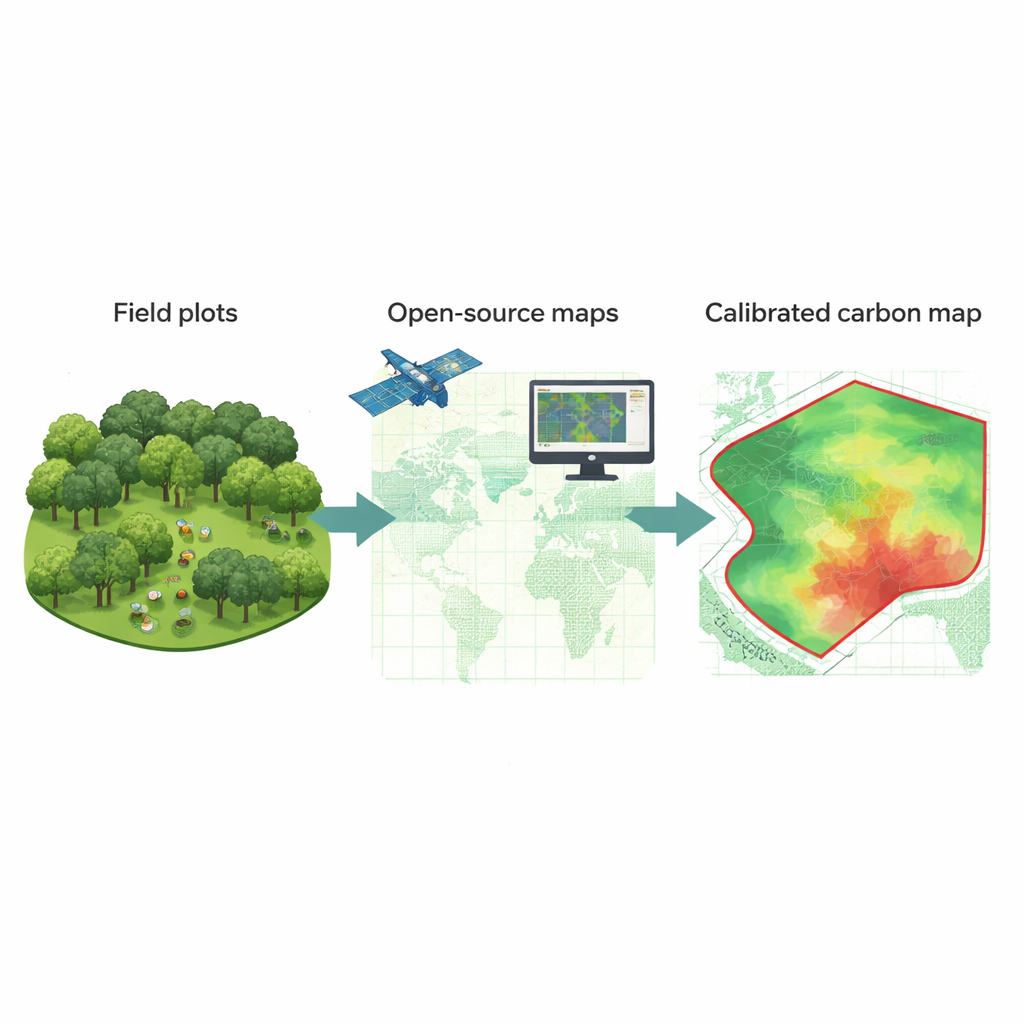
Traditionally, estimating forest carbon on a farm or private reserve has meant laying out plots, measuring tree sizes, converting those measurements to biomass and then assuming that a handful of plots represent hundreds or thousands of hectares. This approach is costly, slow, and leaves big gaps, especially in varied landscapes where carbon can change sharply over short distances. High-end solutions—like airborne LiDAR or custom satellite analysis—can fill those gaps, but they are often too complex and expensive for many projects. The authors instead set out to test a simpler route: start with geolocated field plots (where each plot has known coordinates and a measured carbon stock), and then borrow information from open, global maps that already describe forest height or biomass everywhere.
Making global maps work locally
The team examined four large-scale products: two global or regional biomass maps and two global canopy height maps. Working in dense Amazonian forest in Pará, Brazil, they compared each map against “ground truth” from field plots and a high-quality drone-based LiDAR survey. One canopy height map in particular, from Lang and colleagues, matched local LiDAR heights best, even if it slightly overestimated tree tops on average. The biomass maps, by contrast, struggled in such dense forest, with weak correlation and signs of “saturation,” where very tall or crowded stands all look similar from space. These tests confirmed that not all open-source maps are equal, and that selecting and calibrating the best one for a given region is crucial.
Letting location and height do the heavy lifting
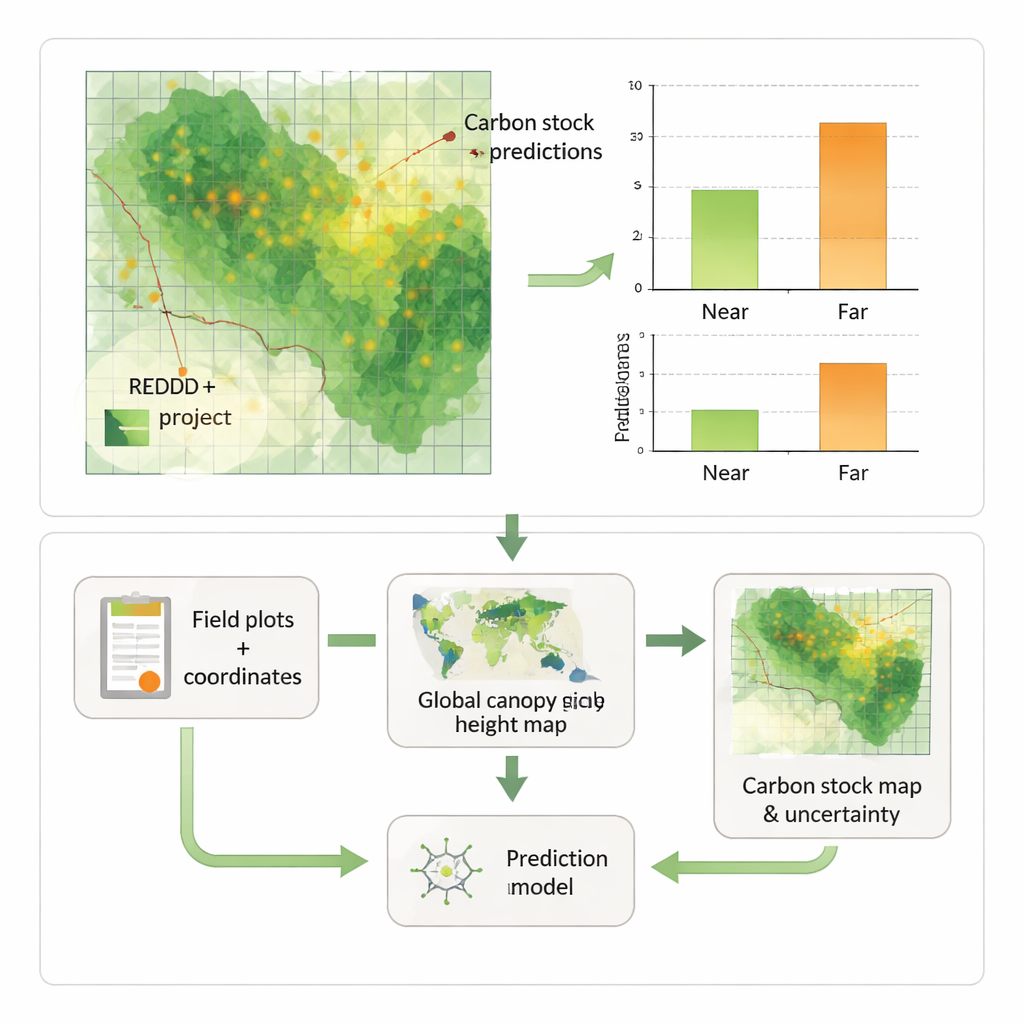
Armed with a good canopy height map, the authors built straightforward prediction models that used two pieces of information for each location: its coordinates (latitude and longitude) and the canopy height from the global map. They trained the models on half of their field plots and asked them to predict carbon for the rest. When predictions were made close to existing plots—mimicking estimates inside a REDD+ project—adding coordinates alone cut average error by about 18 percent compared with simply using a single mean value for the whole area. Combining coordinates with the global canopy height map reduced error by nearly 32 percent. Even when predicting farther away, across the broader region, the global map still improved accuracy by almost 19 percent, though simple coordinates no longer helped much at those larger distances.
Turning numbers into wall‑to‑wall maps
Because the models work pixel by pixel, they can convert scattered plot data into continuous “wall‑to‑wall” carbon maps at high resolution across entire project areas. Instead of one average value per property, project developers can see detailed patterns: ridges and valleys of carbon density, patches that store more or less carbon, and potential hotspots for conservation or restoration. The same framework also supports mapping uncertainty, giving project developers and auditors a clearer handle on how confident they should be in each pixel and in the total carbon claimed for credits.
What this means for forest carbon projects
For landowners, NGOs, and companies running REDD+ projects, the study’s message is practical and reassuring. You do not need cutting-edge, local remote sensing to meaningfully improve carbon estimates; a solid set of geolocated field plots plus the right open-source maps can get you much closer to the accuracy of costly LiDAR campaigns. The key steps are to choose and test a suitable global canopy or biomass map, calibrate it with local field data, and then use simple, well-documented models to generate carbon maps. As global mapping products continue to improve, this accessible approach should make carbon accounting more transparent, consistent, and reliable across the rapidly expanding forest carbon market.
Citation: Haneda, L.E., de Almeida, D.R.A., Kamimura, R.A. et al. Straightforward model-based approach using only field data and open-source maps to improve carbon stock estimates for REDD + projects. Sci Rep 16, 6558 (2026). https://doi.org/10.1038/s41598-026-37201-x
Keywords: forest carbon, REDD+, biomass mapping, remote sensing, tropical forests